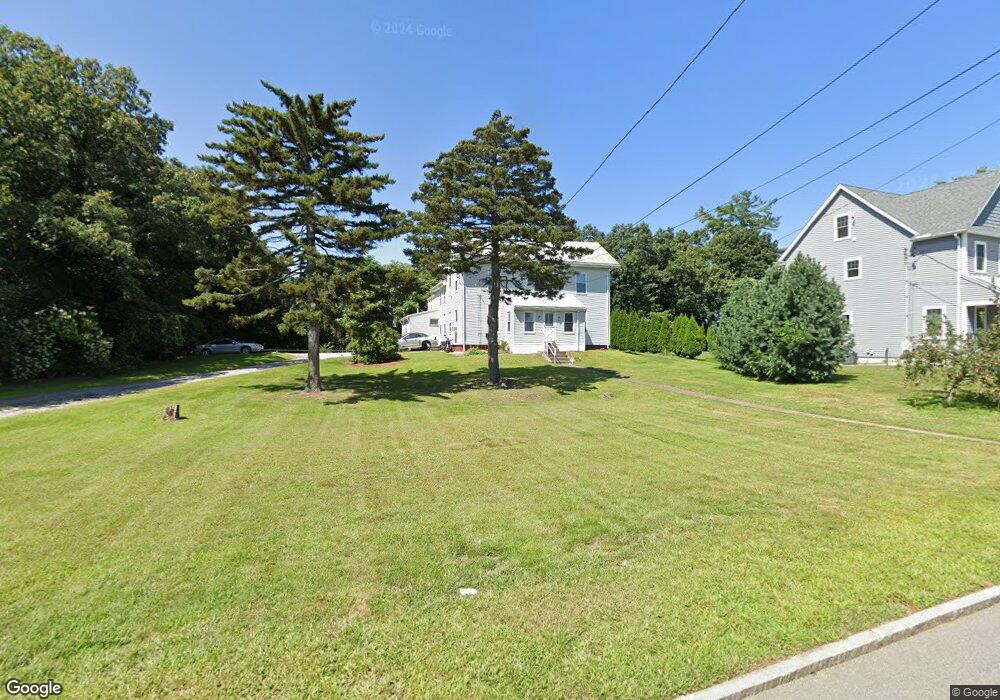
69 Kilby St Woburn, MA 01801
Downtown Woburn NeighborhoodEstimated Value: $824,886 - $917,000
5
Beds
2
Baths
2,964
Sq Ft
$289/Sq Ft
Est. Value
About This Home
This home is located at 69 Kilby St, Woburn, MA 01801 and is currently estimated at $856,222, approximately $288 per square foot. 69 Kilby St is a home located in Middlesex County with nearby schools including Malcolm White Elementary School, John F. Kennedy Middle School, and Woburn High School.
Ownership History
Date
Name
Owned For
Owner Type
Purchase Details
Closed on
Nov 20, 2015
Sold by
John A Buttaro Inc
Bought by
Heritage Builders Inc
Current Estimated Value
Home Financials for this Owner
Home Financials are based on the most recent Mortgage that was taken out on this home.
Original Mortgage
$476,500
Outstanding Balance
$374,790
Interest Rate
3.79%
Mortgage Type
New Conventional
Estimated Equity
$481,432
Purchase Details
Closed on
Aug 20, 2015
Sold by
Barbas Peter E and Barbas Joyce
Bought by
Matrundola Andrew and Matrundola Katherine
Create a Home Valuation Report for This Property
The Home Valuation Report is an in-depth analysis detailing your home's value as well as a comparison with similar homes in the area
Home Values in the Area
Average Home Value in this Area
Purchase History
| Date | Buyer | Sale Price | Title Company |
|---|---|---|---|
| Heritage Builders Inc | $202,000 | -- | |
| Matrundola Andrew | $265,000 | -- | |
| John A Buttaro Inc | $160,000 | -- |
Source: Public Records
Mortgage History
| Date | Status | Borrower | Loan Amount |
|---|---|---|---|
| Open | Heritage Builders Inc | $476,500 |
Source: Public Records
Tax History Compared to Growth
Tax History
| Year | Tax Paid | Tax Assessment Tax Assessment Total Assessment is a certain percentage of the fair market value that is determined by local assessors to be the total taxable value of land and additions on the property. | Land | Improvement |
|---|---|---|---|---|
| 2025 | $6,459 | $756,300 | $360,100 | $396,200 |
| 2024 | $5,884 | $730,000 | $344,100 | $385,900 |
| 2023 | $5,935 | $682,200 | $312,900 | $369,300 |
| 2022 | $5,633 | $603,100 | $275,100 | $328,000 |
| 2021 | $5,515 | $591,100 | $263,100 | $328,000 |
| 2020 | $5,028 | $539,500 | $263,100 | $276,400 |
| 2019 | $4,664 | $490,900 | $251,700 | $239,200 |
| 2018 | $4,620 | $467,100 | $232,800 | $234,300 |
| 2017 | $3,939 | $396,300 | $222,900 | $173,400 |
| 2016 | $3,797 | $377,800 | $218,600 | $159,200 |
| 2015 | $3,718 | $365,600 | $206,400 | $159,200 |
| 2014 | $3,686 | $353,100 | $206,400 | $146,700 |
Source: Public Records
Map
Nearby Homes