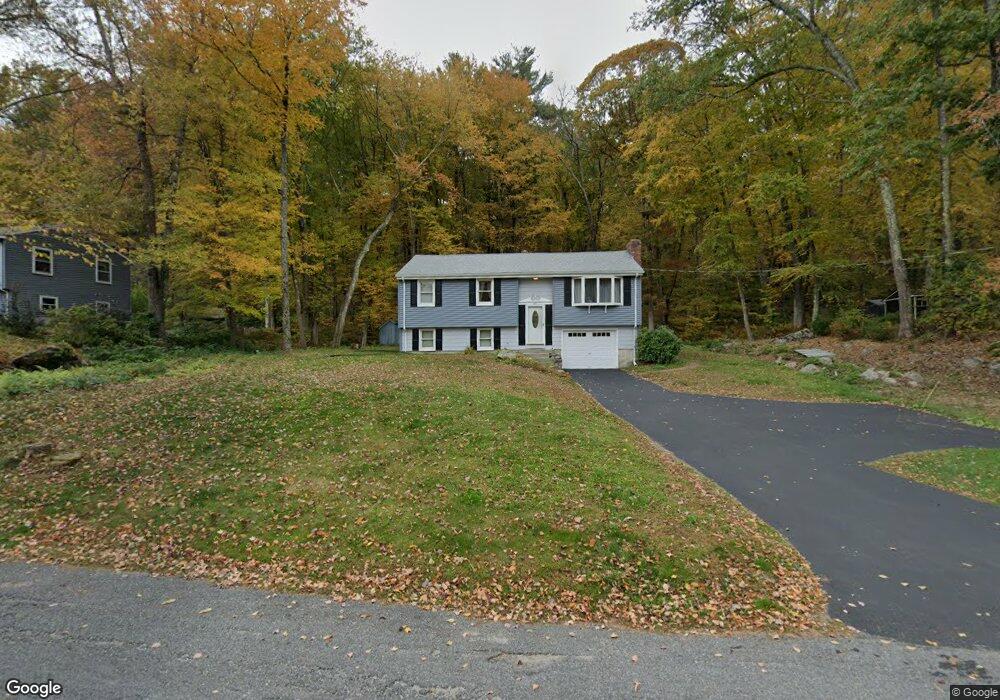
69 Larned Rd Oxford, MA 01540
Estimated Value: $445,000 - $473,000
3
Beds
1
Bath
1,194
Sq Ft
$381/Sq Ft
Est. Value
About This Home
This home is located at 69 Larned Rd, Oxford, MA 01540 and is currently estimated at $454,693, approximately $380 per square foot. 69 Larned Rd is a home located in Worcester County with nearby schools including Alfred M Chaffee, Oxford High School, and Clara Barton Elementary School.
Ownership History
Date
Name
Owned For
Owner Type
Purchase Details
Closed on
Sep 2, 2005
Sold by
Roy Joseph H and Roy Lynne E
Bought by
Pupka Michelle A
Current Estimated Value
Home Financials for this Owner
Home Financials are based on the most recent Mortgage that was taken out on this home.
Original Mortgage
$213,600
Outstanding Balance
$113,989
Interest Rate
5.81%
Mortgage Type
Purchase Money Mortgage
Estimated Equity
$340,704
Create a Home Valuation Report for This Property
The Home Valuation Report is an in-depth analysis detailing your home's value as well as a comparison with similar homes in the area
Home Values in the Area
Average Home Value in this Area
Purchase History
| Date | Buyer | Sale Price | Title Company |
|---|---|---|---|
| Pupka Michelle A | $267,000 | -- |
Source: Public Records
Mortgage History
| Date | Status | Borrower | Loan Amount |
|---|---|---|---|
| Open | Pupka Michelle A | $213,600 |
Source: Public Records
Tax History Compared to Growth
Tax History
| Year | Tax Paid | Tax Assessment Tax Assessment Total Assessment is a certain percentage of the fair market value that is determined by local assessors to be the total taxable value of land and additions on the property. | Land | Improvement |
|---|---|---|---|---|
| 2025 | $49 | $384,800 | $100,400 | $284,400 |
| 2024 | $4,603 | $341,500 | $93,400 | $248,100 |
| 2023 | $4,522 | $331,500 | $83,400 | $248,100 |
| 2022 | $4,008 | $248,000 | $68,200 | $179,800 |
| 2021 | $3,898 | $235,800 | $64,800 | $171,000 |
| 2020 | $3,525 | $211,600 | $64,800 | $146,800 |
| 2019 | $3,488 | $204,800 | $65,000 | $139,800 |
| 2018 | $3,316 | $192,000 | $65,000 | $127,000 |
| 2017 | $3,318 | $196,900 | $65,000 | $131,900 |
| 2016 | $3,334 | $196,900 | $65,000 | $131,900 |
| 2015 | $3,109 | $196,900 | $65,000 | $131,900 |
| 2014 | $3,053 | $203,500 | $65,000 | $138,500 |
Source: Public Records
Map
Nearby Homes