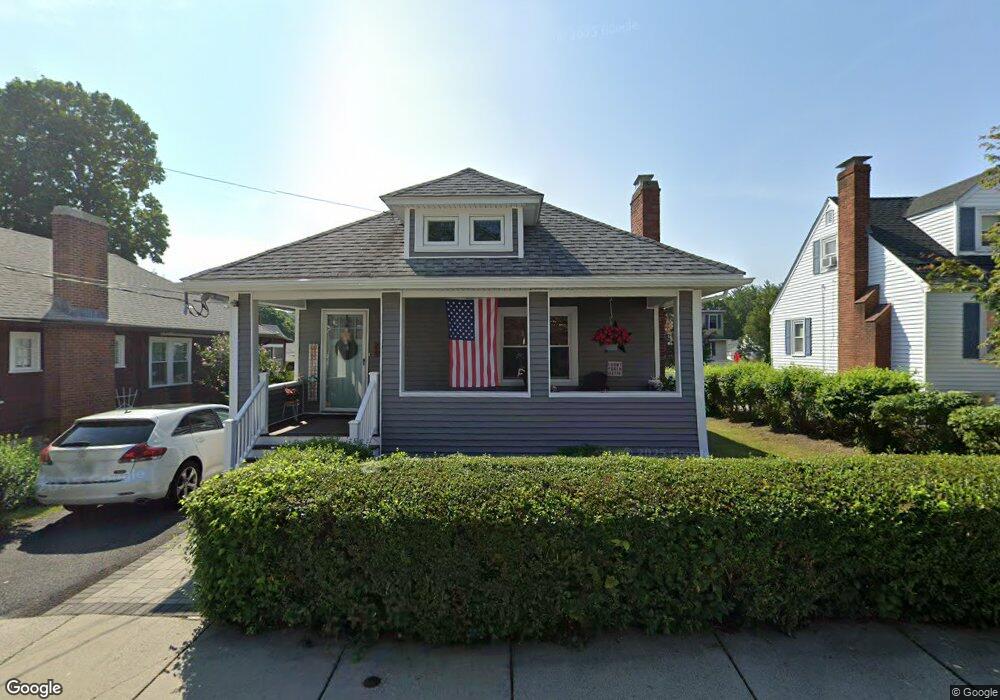
69 Lasell St Unit 1 West Roxbury, MA 02132
West Roxbury NeighborhoodEstimated Value: $647,366 - $727,000
2
Beds
1
Bath
1,050
Sq Ft
$645/Sq Ft
Est. Value
About This Home
This home is located at 69 Lasell St Unit 1, West Roxbury, MA 02132 and is currently estimated at $677,592, approximately $645 per square foot. 69 Lasell St Unit 1 is a home located in Suffolk County with nearby schools including St Theresa School, Catholic Memorial School, and The Roxbury Latin School.
Ownership History
Date
Name
Owned For
Owner Type
Purchase Details
Closed on
Oct 7, 2022
Sold by
Mccarthy Kristina
Bought by
Kristina Mccarthy Lt
Current Estimated Value
Purchase Details
Closed on
Sep 26, 2014
Sold by
Chamo Salwa and Chamo Mike
Bought by
Mccarthy Kristina
Home Financials for this Owner
Home Financials are based on the most recent Mortgage that was taken out on this home.
Original Mortgage
$300,000
Interest Rate
4.12%
Mortgage Type
New Conventional
Purchase Details
Closed on
Feb 14, 2011
Sold by
Chamo Milad
Bought by
Chamo Salwa and Chamo Mike
Purchase Details
Closed on
Jun 28, 2004
Sold by
Concannon Noreen M and Connelly Noreen M
Bought by
Chamo Milad
Create a Home Valuation Report for This Property
The Home Valuation Report is an in-depth analysis detailing your home's value as well as a comparison with similar homes in the area
Home Values in the Area
Average Home Value in this Area
Purchase History
| Date | Buyer | Sale Price | Title Company |
|---|---|---|---|
| Kristina Mccarthy Lt | -- | None Available | |
| Mccarthy Kristina | $375,000 | -- | |
| Chamo Salwa | -- | -- | |
| Chamo Milad | $347,000 | -- |
Source: Public Records
Mortgage History
| Date | Status | Borrower | Loan Amount |
|---|---|---|---|
| Previous Owner | Mccarthy Kristina | $300,000 | |
| Previous Owner | Chamo Milad | $105,000 |
Source: Public Records
Tax History Compared to Growth
Tax History
| Year | Tax Paid | Tax Assessment Tax Assessment Total Assessment is a certain percentage of the fair market value that is determined by local assessors to be the total taxable value of land and additions on the property. | Land | Improvement |
|---|---|---|---|---|
| 2025 | $6,366 | $549,700 | $199,900 | $349,800 |
| 2024 | $5,929 | $543,900 | $201,000 | $342,900 |
| 2023 | $5,563 | $518,000 | $191,400 | $326,600 |
| 2022 | $5,123 | $470,900 | $174,000 | $296,900 |
| 2021 | $4,868 | $456,200 | $170,600 | $285,600 |
| 2020 | $4,310 | $408,100 | $154,700 | $253,400 |
| 2019 | $4,082 | $387,300 | $133,000 | $254,300 |
| 2018 | $3,758 | $358,600 | $133,000 | $225,600 |
| 2017 | $3,722 | $351,500 | $133,000 | $218,500 |
| 2016 | $3,753 | $341,200 | $133,000 | $208,200 |
| 2015 | $3,700 | $305,500 | $149,200 | $156,300 |
| 2014 | $3,626 | $288,200 | $149,200 | $139,000 |
Source: Public Records
Map
Nearby Homes
- 9 Carroll St
- 331 Vermont St
- 89 Dwinell St
- 577 Baker St Unit 577
- 76 Vermont St
- 105 Chesbrough Rd
- 183 Temple St
- 539 Lagrange St
- 59 Chesbrough Rd
- 579 Baker St Unit 579
- 76 Potomac St
- 845 Lagrange St Unit 4
- 865 Lagrange St Unit 5
- 73 Dent St Unit 1
- 28 Dow Rd
- 340 Baker St Unit 1
- 37 Pomfret St
- 139 Newfield St
- 701 Vfw Pkwy
- 14 Sanborn Ave