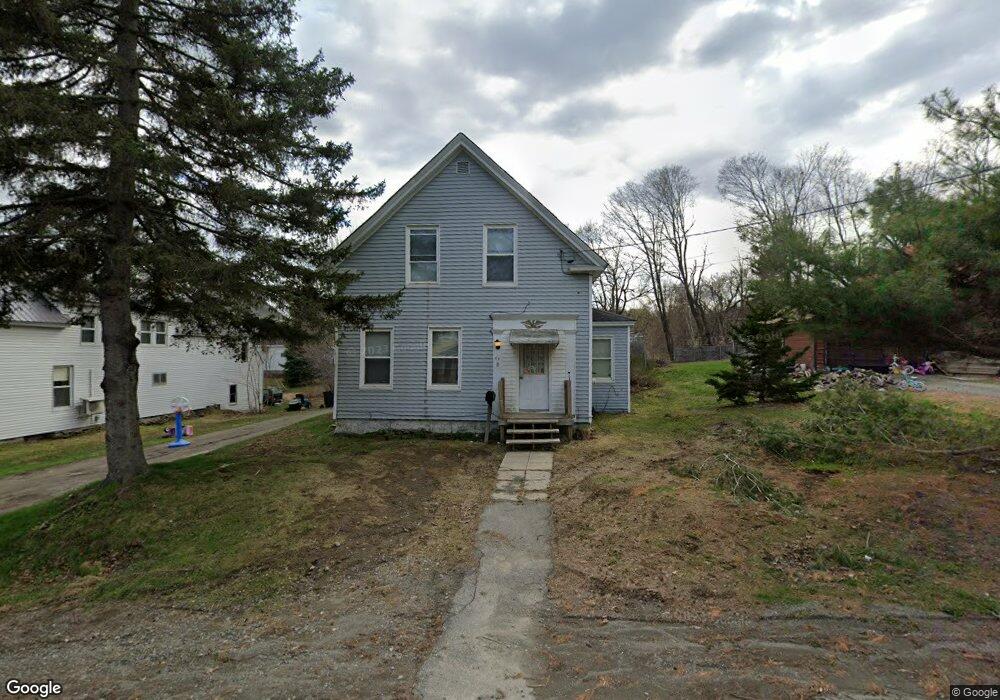
69 Lincoln St Dexter, ME 04930
Estimated Value: $236,000
3
Beds
2
Baths
1,200
Sq Ft
$197/Sq Ft
Est. Value
About This Home
This home is located at 69 Lincoln St, Dexter, ME 04930 and is currently estimated at $236,000, approximately $196 per square foot. 69 Lincoln St is a home located in Penobscot County with nearby schools including Ridge View Community School, Dexter Regional High School, and Dexter Christian Academy.
Ownership History
Date
Name
Owned For
Owner Type
Purchase Details
Closed on
Mar 5, 2021
Sold by
Haskell Lisa A and Haskell Mary J
Bought by
Salley Anthony W and Andrews Nichole
Current Estimated Value
Home Financials for this Owner
Home Financials are based on the most recent Mortgage that was taken out on this home.
Original Mortgage
$50,321
Outstanding Balance
$46,203
Interest Rate
4.25%
Mortgage Type
Purchase Money Mortgage
Estimated Equity
$189,797
Purchase Details
Closed on
Jun 16, 2010
Sold by
Flynn Mary A
Bought by
Gould Mary J and Tracy Lisa H
Home Financials for this Owner
Home Financials are based on the most recent Mortgage that was taken out on this home.
Original Mortgage
$31,920
Interest Rate
5.03%
Mortgage Type
FHA
Create a Home Valuation Report for This Property
The Home Valuation Report is an in-depth analysis detailing your home's value as well as a comparison with similar homes in the area
Home Values in the Area
Average Home Value in this Area
Purchase History
| Date | Buyer | Sale Price | Title Company |
|---|---|---|---|
| Salley Anthony W | -- | None Available | |
| Salley Anthony W | -- | None Available | |
| Gould Mary J | -- | -- | |
| Gould Mary J | -- | -- |
Source: Public Records
Mortgage History
| Date | Status | Borrower | Loan Amount |
|---|---|---|---|
| Open | Salley Anthony W | $50,321 | |
| Closed | Salley Anthony W | $50,321 | |
| Previous Owner | Gould Mary J | $31,920 |
Source: Public Records
Tax History
| Year | Tax Paid | Tax Assessment Tax Assessment Total Assessment is a certain percentage of the fair market value that is determined by local assessors to be the total taxable value of land and additions on the property. | Land | Improvement |
|---|---|---|---|---|
| 2024 | $1,260 | $64,300 | $12,600 | $51,700 |
| 2023 | $1,265 | $64,200 | $12,500 | $51,700 |
| 2022 | $1,262 | $63,100 | $11,400 | $51,700 |
| 2021 | $1,237 | $63,100 | $11,400 | $51,700 |
| 2020 | $1,237 | $63,100 | $11,400 | $51,700 |
| 2019 | $1,237 | $63,100 | $11,400 | $51,700 |
| 2018 | $1,237 | $63,100 | $11,400 | $51,700 |
| 2017 | $1,205 | $63,100 | $11,400 | $51,700 |
| 2016 | $1,174 | $63,100 | $11,400 | $51,700 |
| 2015 | $1,174 | $63,100 | $11,400 | $51,700 |
| 2014 | $1,117 | $63,100 | $11,400 | $51,700 |
Source: Public Records
Map
Nearby Homes
Your Personal Tour Guide
Ask me questions while you tour the home.