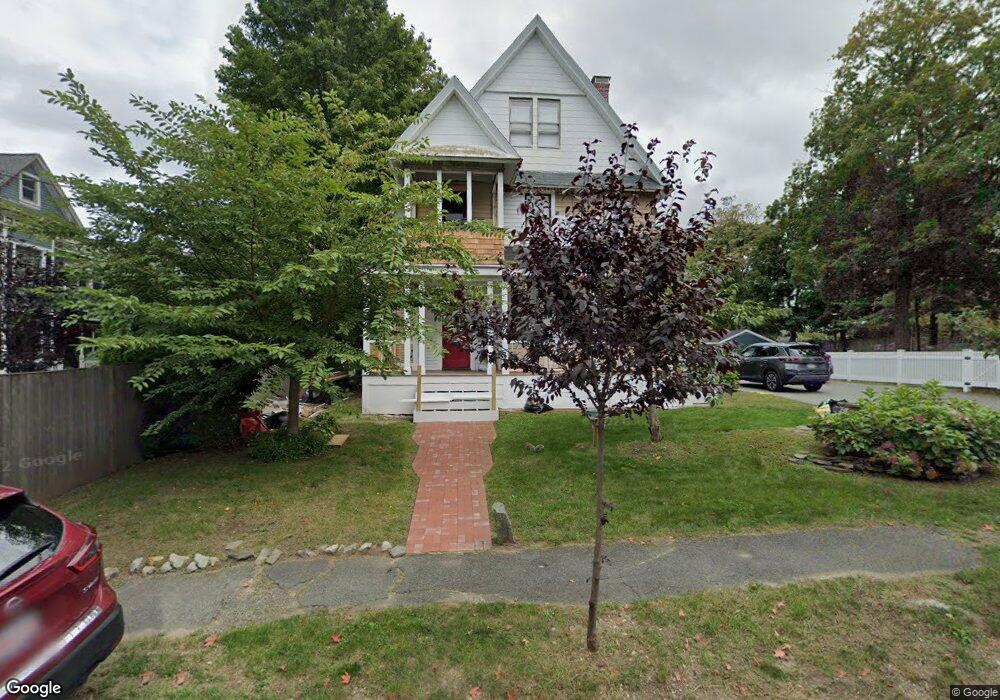
69 Linden St Reading, MA 01867
Estimated Value: $937,516 - $1,205,000
4
Beds
3
Baths
2,488
Sq Ft
$410/Sq Ft
Est. Value
About This Home
This home is located at 69 Linden St, Reading, MA 01867 and is currently estimated at $1,018,879, approximately $409 per square foot. 69 Linden St is a home located in Middlesex County with nearby schools including Birch Meadow Elementary School, Walter S. Parker Middle School, and Reading Memorial High School.
Ownership History
Date
Name
Owned For
Owner Type
Purchase Details
Closed on
Oct 24, 2023
Sold by
Rose-Gillis Karen
Bought by
Rosie Lt and Rose-Gillis
Current Estimated Value
Purchase Details
Closed on
Jun 3, 2011
Sold by
Gillis William D
Bought by
Rose-Gillis Karen
Purchase Details
Closed on
Oct 5, 1993
Sold by
Stackhouse Donald B and Stackhouse Joan E
Bought by
Gillis William D
Home Financials for this Owner
Home Financials are based on the most recent Mortgage that was taken out on this home.
Original Mortgage
$178,200
Interest Rate
7%
Mortgage Type
Purchase Money Mortgage
Purchase Details
Closed on
Feb 24, 1993
Sold by
Fnma
Bought by
Le Cuong M
Purchase Details
Closed on
Nov 20, 1992
Sold by
Oreto Frank
Bought by
Meridian Mtg Corp
Purchase Details
Closed on
Jun 10, 1992
Sold by
Girardi Michael
Bought by
Comfed Sb
Create a Home Valuation Report for This Property
The Home Valuation Report is an in-depth analysis detailing your home's value as well as a comparison with similar homes in the area
Home Values in the Area
Average Home Value in this Area
Purchase History
| Date | Buyer | Sale Price | Title Company |
|---|---|---|---|
| Rosie Lt | -- | None Available | |
| Rose-Gillis Karen | -- | -- | |
| Gillis William D | $198,000 | -- | |
| Le Cuong M | $19,500 | -- | |
| Meridian Mtg Corp | $31,500 | -- | |
| Comfed Sb | $38,700 | -- |
Source: Public Records
Mortgage History
| Date | Status | Borrower | Loan Amount |
|---|---|---|---|
| Previous Owner | Comfed Sb | $50,000 | |
| Previous Owner | Comfed Sb | $178,200 |
Source: Public Records
Tax History
| Year | Tax Paid | Tax Assessment Tax Assessment Total Assessment is a certain percentage of the fair market value that is determined by local assessors to be the total taxable value of land and additions on the property. | Land | Improvement |
|---|---|---|---|---|
| 2025 | $9,171 | $805,200 | $473,600 | $331,600 |
| 2024 | $9,276 | $791,500 | $465,500 | $326,000 |
| 2023 | $9,390 | $745,800 | $438,600 | $307,200 |
| 2022 | $9,095 | $682,300 | $401,300 | $281,000 |
| 2021 | $8,727 | $631,900 | $346,100 | $285,800 |
| 2020 | $5,923 | $611,500 | $334,900 | $276,600 |
| 2019 | $8,158 | $573,300 | $314,000 | $259,300 |
| 2018 | $5,341 | $545,700 | $298,900 | $246,800 |
| 2017 | $5,173 | $509,600 | $279,100 | $230,500 |
| 2016 | $7,093 | $489,200 | $280,100 | $209,100 |
| 2015 | $6,847 | $465,800 | $266,700 | $199,100 |
| 2014 | $6,387 | $433,300 | $248,100 | $185,200 |
Source: Public Records
Map
Nearby Homes
- 52 Sanborn St Unit 7
- 69 Ash St
- 5 Washington St Unit D4
- 863 Main St
- 35 Longfellow Rd
- 89 Grand St
- 48 Village St Unit 1001
- 64 Longfellow Rd
- 100 Prescott St
- 24 Smith Ave
- 103 Orange St
- 41 Winter St
- 101 King St Unit 101
- 3 Carnation Cir Unit C
- 37 Fremont St
- 20 Pinevale Ave
- 45 Longview Rd
- 319 West St
- 241 Main St Unit C3
- 237 Salem St Unit 2
- 73 Linden St
- 60 Sanborn St
- 54 Lowell St
- 64 Sanborn St
- 52 Sanborn St Unit 409
- 52 Sanborn St Unit 407
- 52 Sanborn St Unit 406
- 52 Sanborn St Unit 405
- 52 Sanborn St Unit 404
- 52 Sanborn St Unit 403
- 52 Sanborn St Unit 402
- 52 Sanborn St Unit 401
- 52 Sanborn St Unit 309
- 52 Sanborn St Unit 308
- 52 Sanborn St Unit 307
- 52 Sanborn St Unit 306
- 52 Sanborn St Unit 302
- 52 Sanborn St Unit 208
- 52 Sanborn St Unit 207
- 52 Sanborn St Unit 206
Your Personal Tour Guide
Ask me questions while you tour the home.