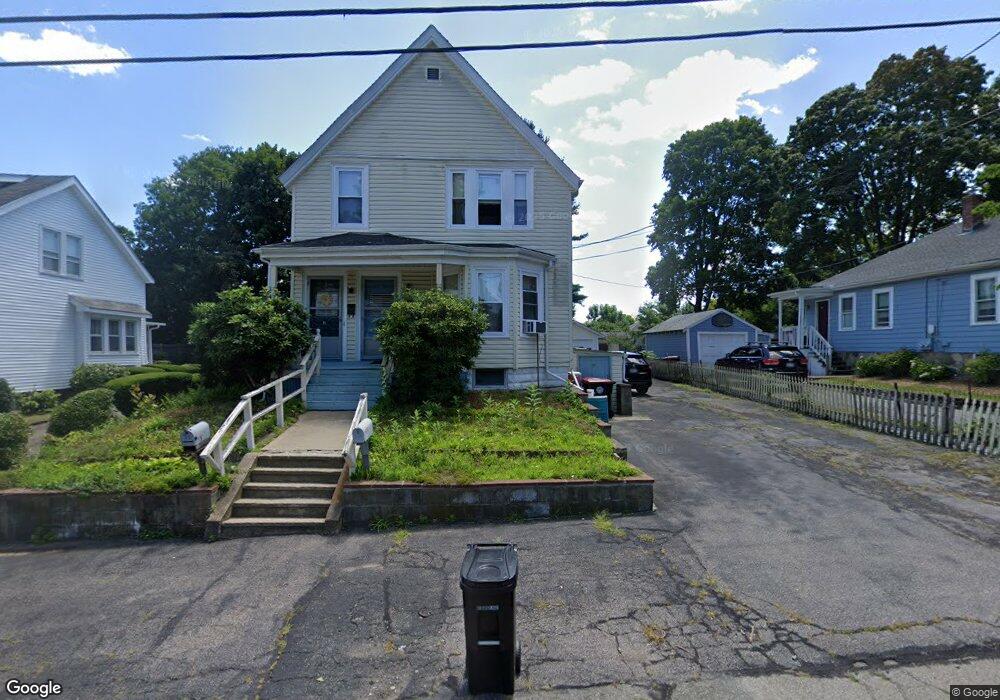
69 Locust St Brockton, MA 02301
Montello NeighborhoodEstimated Value: $620,262 - $777,000
4
Beds
3
Baths
2,782
Sq Ft
$244/Sq Ft
Est. Value
About This Home
This home is located at 69 Locust St, Brockton, MA 02301 and is currently estimated at $679,566, approximately $244 per square foot. 69 Locust St is a home located in Plymouth County with nearby schools including Raymond K-8 Elementary School, Louis F Angelo Elementary School, and Manthala George Jr. School.
Ownership History
Date
Name
Owned For
Owner Type
Purchase Details
Closed on
Oct 6, 1989
Sold by
Sears Harold G
Bought by
Vanquan Quoc
Current Estimated Value
Home Financials for this Owner
Home Financials are based on the most recent Mortgage that was taken out on this home.
Original Mortgage
$100,000
Interest Rate
10.12%
Mortgage Type
Purchase Money Mortgage
Create a Home Valuation Report for This Property
The Home Valuation Report is an in-depth analysis detailing your home's value as well as a comparison with similar homes in the area
Home Values in the Area
Average Home Value in this Area
Purchase History
| Date | Buyer | Sale Price | Title Company |
|---|---|---|---|
| Vanquan Quoc | $145,000 | -- |
Source: Public Records
Mortgage History
| Date | Status | Borrower | Loan Amount |
|---|---|---|---|
| Closed | Vanquan Quoc | $147,000 | |
| Closed | Vanquan Quoc | $100,000 |
Source: Public Records
Tax History Compared to Growth
Tax History
| Year | Tax Paid | Tax Assessment Tax Assessment Total Assessment is a certain percentage of the fair market value that is determined by local assessors to be the total taxable value of land and additions on the property. | Land | Improvement |
|---|---|---|---|---|
| 2025 | $6,855 | $566,100 | $140,100 | $426,000 |
| 2024 | $6,742 | $560,900 | $140,100 | $420,800 |
| 2023 | $6,346 | $488,900 | $104,200 | $384,700 |
| 2022 | $6,401 | $458,200 | $94,700 | $363,500 |
| 2021 | $5,929 | $408,900 | $78,600 | $330,300 |
| 2020 | $5,233 | $345,400 | $73,700 | $271,700 |
| 2019 | $5,490 | $353,300 | $71,900 | $281,400 |
| 2018 | $4,799 | $298,800 | $71,900 | $226,900 |
| 2017 | $4,888 | $303,600 | $71,900 | $231,700 |
| 2016 | $4,448 | $256,200 | $69,700 | $186,500 |
| 2015 | $3,679 | $202,700 | $69,700 | $133,000 |
| 2014 | $3,534 | $194,900 | $69,700 | $125,200 |
Source: Public Records
Map
Nearby Homes
- 11 Winsten St
- 932 N Main St Unit 5
- 863 N Main St
- 41 Martland Ave
- 25 Merritt Ave
- 279 Howard St
- 24 Oak St
- 105 Oscar Ave
- 706 W Main St
- 60 Bonney St
- 20 Johnson Ct
- 221 Oak St Unit 8-12
- 47 Beech Rd
- 737 N Montello St
- 178 Oak St
- 731 N Montello St Unit 6
- 51 Colantha Ave
- 200 Sawtell Ave
- 77 Porter St
- 30 Intervale St