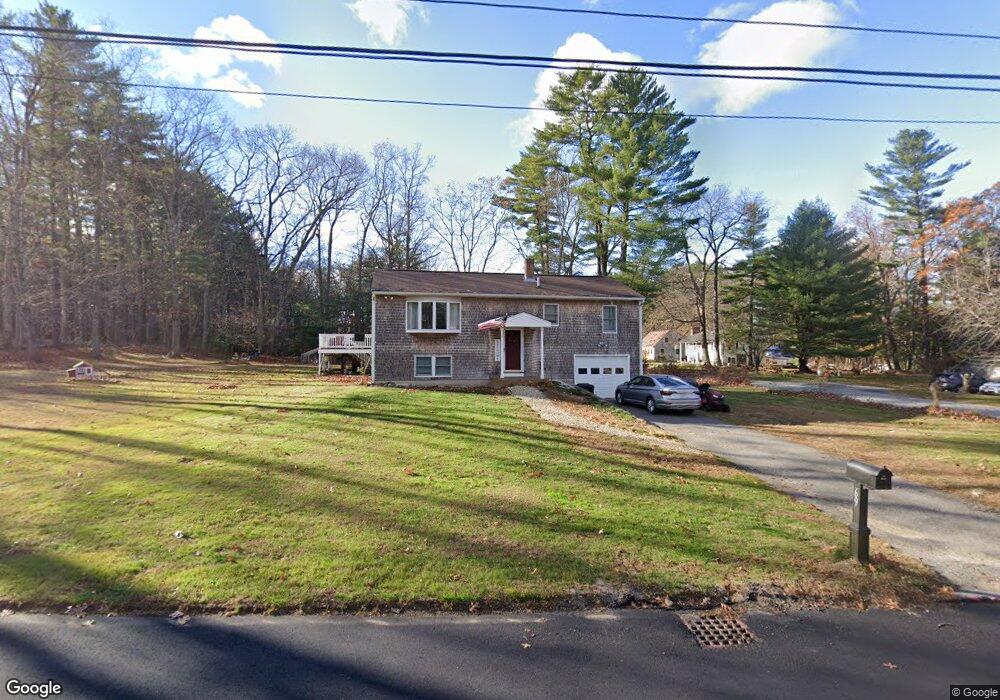
69 Locust St Salisbury, MA 01952
Estimated Value: $562,438 - $746,000
3
Beds
2
Baths
1,580
Sq Ft
$403/Sq Ft
Est. Value
About This Home
This home is located at 69 Locust St, Salisbury, MA 01952 and is currently estimated at $637,110, approximately $403 per square foot. 69 Locust St is a home located in Essex County with nearby schools including Triton Regional High School.
Ownership History
Date
Name
Owned For
Owner Type
Purchase Details
Closed on
Apr 1, 2022
Sold by
Heyes Eileen Est and Lizotte
Bought by
Heyes Ft and Clark
Current Estimated Value
Purchase Details
Closed on
Jan 17, 2019
Sold by
Mason Cheryl A and Mason Jeffrey R
Bought by
Heyes Eileen
Create a Home Valuation Report for This Property
The Home Valuation Report is an in-depth analysis detailing your home's value as well as a comparison with similar homes in the area
Home Values in the Area
Average Home Value in this Area
Purchase History
| Date | Buyer | Sale Price | Title Company |
|---|---|---|---|
| Heyes Ft | -- | None Available | |
| Heyes Ft | -- | None Available | |
| Heyes Eileen | -- | -- |
Source: Public Records
Tax History
| Year | Tax Paid | Tax Assessment Tax Assessment Total Assessment is a certain percentage of the fair market value that is determined by local assessors to be the total taxable value of land and additions on the property. | Land | Improvement |
|---|---|---|---|---|
| 2025 | $4,493 | $445,700 | $187,800 | $257,900 |
| 2024 | $4,116 | $393,900 | $175,600 | $218,300 |
| 2023 | $3,963 | $366,900 | $175,600 | $191,300 |
| 2022 | $3,799 | $341,000 | $158,800 | $182,200 |
| 2021 | $3,616 | $321,100 | $158,800 | $162,300 |
| 2020 | $3,487 | $304,300 | $162,200 | $142,100 |
| 2019 | $3,433 | $289,500 | $157,300 | $132,200 |
| 2018 | $3,394 | $288,100 | $157,300 | $130,800 |
| 2017 | $3,205 | $268,900 | $136,600 | $132,300 |
| 2016 | $3,056 | $261,900 | $134,600 | $127,300 |
| 2015 | $2,965 | $252,300 | $130,400 | $121,900 |
Source: Public Records
Map
Nearby Homes
Your Personal Tour Guide
Ask me questions while you tour the home.