69 Lyman Ave Patchogue, NY 11772
Estimated Value: $646,000 - $1,009,000
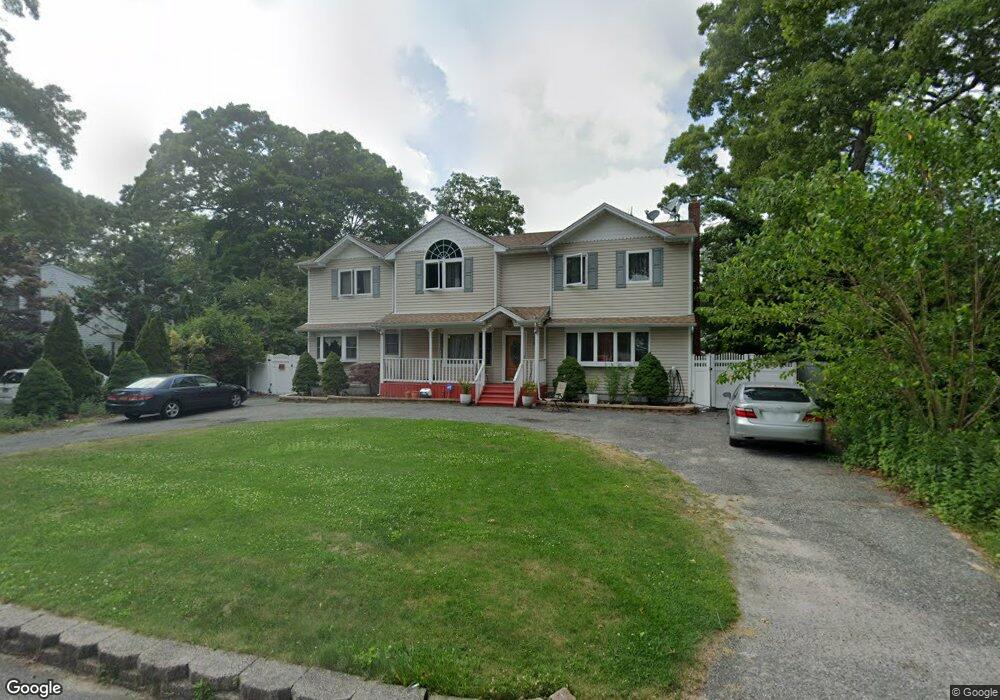
About This Home
This home is located at 69 Lyman Ave, Patchogue, NY 11772 and is currently estimated at $849,397, approximately $279 per square foot. 69 Lyman Ave is a home located in Suffolk County with nearby schools including Patchogue-Medford High School and Holy Angels Regional School.
Ownership History
We collect this data history from publicly available records. To have your information removed, we recommend requesting removal directly through your county’s website.
Purchase Details
Home Financials for this Owner
Home Financials are based on the most recent Mortgage that was taken out on this home.Purchase Details
Home Values in the Area
Average Home Value in this Area
Purchase History
We collect this data history from publicly available records. To have your information removed, we recommend requesting removal directly through your county’s website.
| Date | Buyer | Sale Price | Title Company |
|---|---|---|---|
| $415,000 | All Shore Abstract Ltd | ||
| $415,000 | -- | ||
| -- | First American Title Ins Co |
Mortgage History
We collect this data history from publicly available records. To have your information removed, we recommend requesting removal directly through your county’s website.
| Date | Status | Borrower | Loan Amount |
|---|---|---|---|
| Open | $407,483 |
Tax History
We collect this data history from publicly available records. To have your information removed, we recommend requesting removal directly through your county’s website.
| Year | Tax Paid | Tax Assessment Tax Assessment Total Assessment is a certain percentage of the fair market value that is determined by local assessors to be the total taxable value of land and additions on the property. | Land | Improvement |
|---|---|---|---|---|
| 2024 | $15,672 | $3,735 | $160 | $3,575 |
| 2023 | $15,672 | $3,735 | $160 | $3,575 |
| 2022 | $12,696 | $3,735 | $160 | $3,575 |
| 2021 | $12,696 | $3,735 | $160 | $3,575 |
| 2020 | $14,268 | $3,735 | $160 | $3,575 |
| 2019 | $14,268 | $0 | $0 | $0 |
| 2018 | -- | $3,735 | $160 | $3,575 |
| 2017 | $13,209 | $3,735 | $160 | $3,575 |
| 2016 | $12,912 | $3,735 | $160 | $3,575 |
| 2015 | -- | $3,735 | $160 | $3,575 |
| 2014 | -- | $3,735 | $160 | $3,575 |
Map
- 60 Webb Ave
- 59 Prince St
- 21 Glen Hollow Dr Unit G30
- 25 Glen Hollow Dr Unit H 37
- 18 Glen Hollow Dr Unit F1
- 79 C Traction Blvd
- 14 Glen Hollow Dr Unit E29
- 10 Glen Hollow Dr Unit C12
- 10 Glen Hollow Dr Unit C7
- 6 Glen Hollow Dr Unit A33
- 231 W Woodside Ave
- 107 Newman St
- 25 W Shore Dr
- 79 6th Ave
- 37 Harper St
- 12 Sims St
- 129 Shaber Rd
- 25 Snyder St
- 132 13th Ave
- 134- 1 13th Ave
Ask me questions while you tour the home.