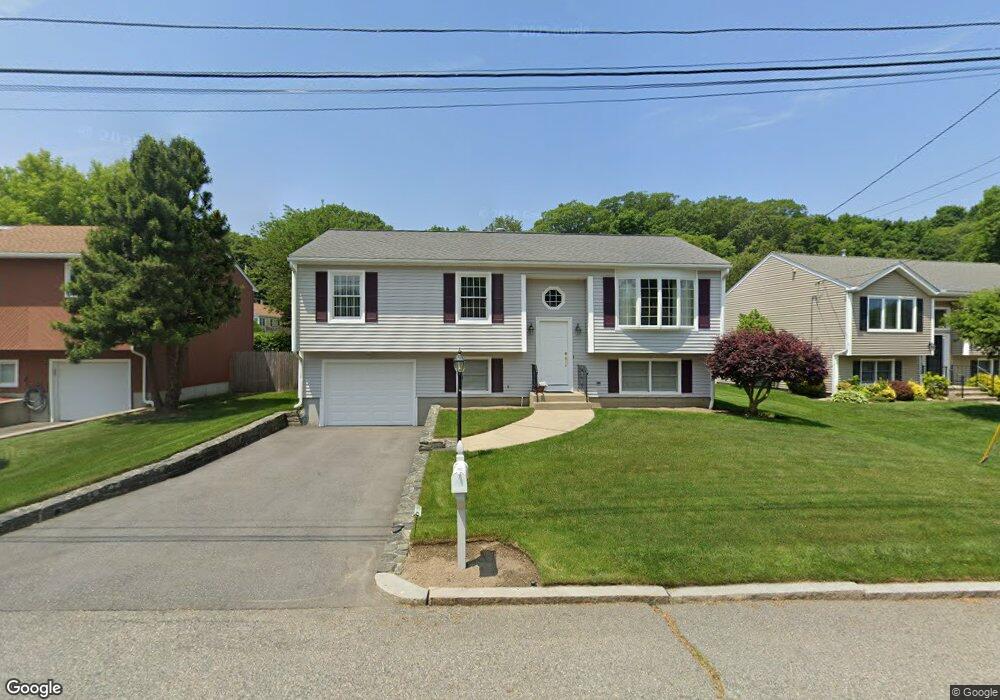
69 Lynde St Providence, RI 02908
Elmhurst NeighborhoodEstimated Value: $385,000 - $474,000
3
Beds
1
Bath
1,074
Sq Ft
$399/Sq Ft
Est. Value
About This Home
This home is located at 69 Lynde St, Providence, RI 02908 and is currently estimated at $429,037, approximately $399 per square foot. 69 Lynde St is a home located in Providence County with nearby schools including Charles N. Fortes Elementary School, Asa Messer Elementary School, and Veazie Street Elementary School.
Ownership History
Date
Name
Owned For
Owner Type
Purchase Details
Closed on
May 2, 1990
Sold by
Kern Michael
Bought by
Rainone Margaret M
Current Estimated Value
Home Financials for this Owner
Home Financials are based on the most recent Mortgage that was taken out on this home.
Original Mortgage
$100,000
Interest Rate
10.18%
Create a Home Valuation Report for This Property
The Home Valuation Report is an in-depth analysis detailing your home's value as well as a comparison with similar homes in the area
Home Values in the Area
Average Home Value in this Area
Purchase History
| Date | Buyer | Sale Price | Title Company |
|---|---|---|---|
| Rainone Margaret M | $133,000 | -- |
Source: Public Records
Mortgage History
| Date | Status | Borrower | Loan Amount |
|---|---|---|---|
| Closed | Rainone Margaret M | $100,000 |
Source: Public Records
Tax History Compared to Growth
Tax History
| Year | Tax Paid | Tax Assessment Tax Assessment Total Assessment is a certain percentage of the fair market value that is determined by local assessors to be the total taxable value of land and additions on the property. | Land | Improvement |
|---|---|---|---|---|
| 2025 | $3,121 | $371,500 | $164,200 | $207,300 |
| 2024 | $5,061 | $275,800 | $106,700 | $169,100 |
| 2023 | $5,061 | $275,800 | $106,700 | $169,100 |
| 2022 | $4,909 | $275,800 | $106,700 | $169,100 |
| 2021 | $5,273 | $214,700 | $86,200 | $128,500 |
| 2020 | $5,273 | $214,700 | $86,200 | $128,500 |
| 2019 | $5,273 | $214,700 | $86,200 | $128,500 |
| 2018 | $5,500 | $172,100 | $69,300 | $102,800 |
| 2017 | $5,500 | $172,100 | $69,300 | $102,800 |
| 2016 | $5,462 | $170,900 | $69,300 | $101,600 |
| 2015 | $4,879 | $147,400 | $69,300 | $78,100 |
| 2014 | $4,975 | $147,400 | $69,300 | $78,100 |
| 2013 | $4,975 | $147,400 | $69,300 | $78,100 |
Source: Public Records
Map
Nearby Homes
- 115 Longwood Ave
- 50 Longwood Ave
- 81 Gentian Ave
- 2 Longwood Ave
- 1285 Smith St
- 190 Enfield Ave
- 1196 Smith St
- 73 High Service Ave
- 68 Enfield Ave
- 14 Ravenswood Ave
- 252 Gentian Ave
- 797 Academy Ave
- 9 Farnum Ave
- 28 Mink Rd
- 507 Sharon St
- 268 Nelson St
- 145 Smithfield Rd Unit B
- 69 Cushing St
- 80 Lubec St
- 15 Lookout Ave