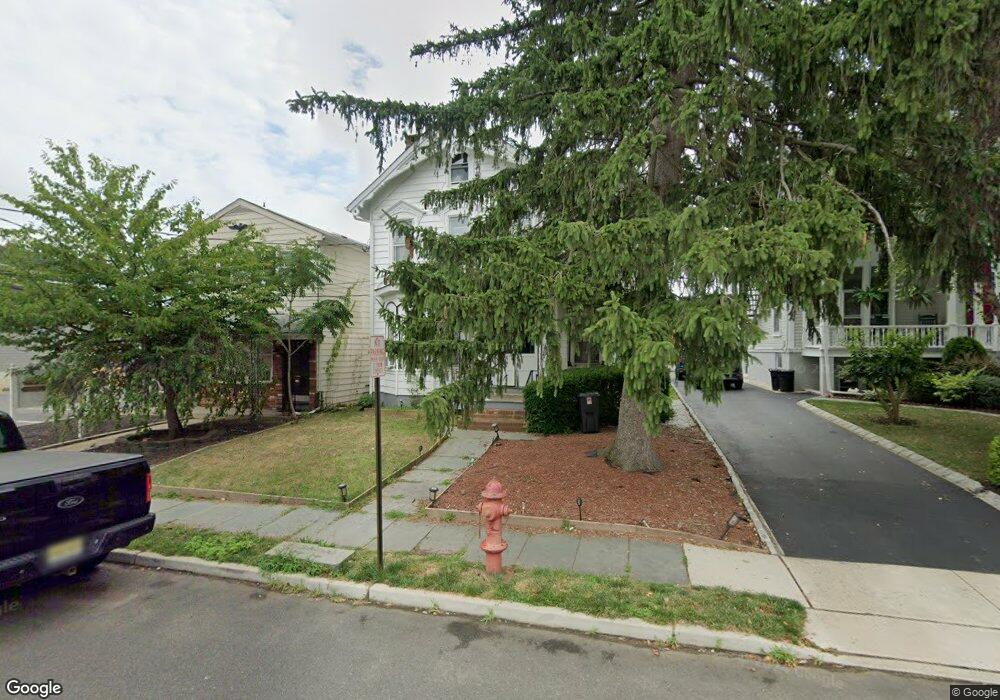
69 Main St Keyport, NJ 07735
Estimated Value: $446,000 - $517,000
4
Beds
2
Baths
1,708
Sq Ft
$289/Sq Ft
Est. Value
About This Home
This home is located at 69 Main St, Keyport, NJ 07735 and is currently estimated at $493,502, approximately $288 per square foot. 69 Main St is a home located in Monmouth County with nearby schools including Keyport Central School, Keyport High School, and Icob Academy.
Ownership History
Date
Name
Owned For
Owner Type
Purchase Details
Closed on
Aug 27, 2021
Sold by
Donaldson Edwin H and Donaldson Judith A
Bought by
Castro Gina Mora and Mora Minor
Current Estimated Value
Home Financials for this Owner
Home Financials are based on the most recent Mortgage that was taken out on this home.
Original Mortgage
$289,656
Outstanding Balance
$263,565
Interest Rate
2.8%
Mortgage Type
New Conventional
Estimated Equity
$229,937
Purchase Details
Closed on
Aug 21, 2021
Sold by
Donaldson Edwin H and Donaldson Judith A
Bought by
Castro Gina Mora and Mora Minor
Home Financials for this Owner
Home Financials are based on the most recent Mortgage that was taken out on this home.
Original Mortgage
$289,656
Outstanding Balance
$263,565
Interest Rate
2.8%
Mortgage Type
New Conventional
Estimated Equity
$229,937
Create a Home Valuation Report for This Property
The Home Valuation Report is an in-depth analysis detailing your home's value as well as a comparison with similar homes in the area
Home Values in the Area
Average Home Value in this Area
Purchase History
| Date | Buyer | Sale Price | Title Company |
|---|---|---|---|
| Castro Gina Mora | $295,000 | Ats Title Agency Inc | |
| Castro Gina Mora | $295,000 | Old Republic Title |
Source: Public Records
Mortgage History
| Date | Status | Borrower | Loan Amount |
|---|---|---|---|
| Open | Castro Gina Mora | $289,656 | |
| Closed | Castro Gina Mora | $289,656 |
Source: Public Records
Tax History
| Year | Tax Paid | Tax Assessment Tax Assessment Total Assessment is a certain percentage of the fair market value that is determined by local assessors to be the total taxable value of land and additions on the property. | Land | Improvement |
|---|---|---|---|---|
| 2025 | $7,688 | $408,300 | $183,400 | $224,900 |
| 2024 | $7,414 | $371,400 | $157,500 | $213,900 |
Source: Public Records
Map
Nearby Homes
- 9 Kearney St Unit A
- 226 Osborn St
- 87 Church St
- 55 E Front St
- 9 Hurley St
- 95 Broadway
- 72 Manchester Ave
- 231 Atlantic St Unit 23
- 231 Atlantic St Unit 83
- 74 Manchester Ave
- 37 Myrtle Ave
- 162 2nd St
- 253 Broadway
- 104 Therese Ave
- 52 Highway 35
- 2108 Florence Ave
- 910 Malden Dr
- 975 S Concourse
- 47 Village Green Way
- 301 Ryan St