Estimated Value: $472,000 - $502,625
4
Beds
2
Baths
2,218
Sq Ft
$220/Sq Ft
Est. Value
About This Home
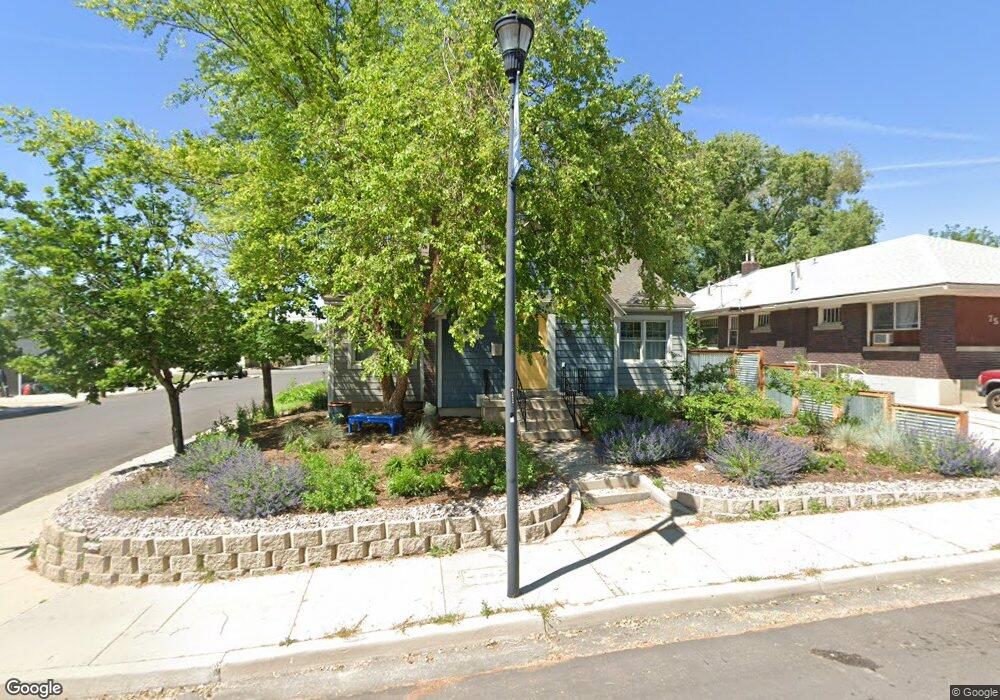
This home is located at 69 Main St, Sandy, UT 84070 and is currently estimated at $487,406, approximately $219 per square foot. 69 Main St is a home located in Salt Lake County with nearby schools including Sandy Elementary School, Mount Jordan Middle School, and Jordan High.
Ownership History
Date
Name
Owned For
Owner Type
Purchase Details
Closed on
Dec 16, 2002
Sold by
Young Aaron A and Young Kristin D
Bought by
Gasperini Joy
Current Estimated Value
Home Financials for this Owner
Home Financials are based on the most recent Mortgage that was taken out on this home.
Original Mortgage
$113,600
Outstanding Balance
$48,059
Interest Rate
6.03%
Estimated Equity
$439,347
Purchase Details
Closed on
Oct 25, 1995
Sold by
Lundberg David W
Bought by
Young Aaron A and Young Kristen D
Home Financials for this Owner
Home Financials are based on the most recent Mortgage that was taken out on this home.
Original Mortgage
$106,317
Interest Rate
7.59%
Mortgage Type
FHA
Purchase Details
Closed on
Jun 21, 1995
Sold by
Lundberg David W
Bought by
Lundberg David W
Home Financials for this Owner
Home Financials are based on the most recent Mortgage that was taken out on this home.
Original Mortgage
$75,000
Interest Rate
7.92%
Create a Home Valuation Report for This Property
The Home Valuation Report is an in-depth analysis detailing your home's value as well as a comparison with similar homes in the area
Home Values in the Area
Average Home Value in this Area
Purchase History
| Date | Buyer | Sale Price | Title Company |
|---|---|---|---|
| Gasperini Joy | -- | Canyon Ridge Title | |
| Young Aaron A | -- | -- | |
| Lundberg David W | -- | -- |
Source: Public Records
Mortgage History
| Date | Status | Borrower | Loan Amount |
|---|---|---|---|
| Open | Gasperini Joy | $113,600 | |
| Previous Owner | Young Aaron A | $106,317 | |
| Previous Owner | Lundberg David W | $75,000 |
Source: Public Records
Tax History
| Year | Tax Paid | Tax Assessment Tax Assessment Total Assessment is a certain percentage of the fair market value that is determined by local assessors to be the total taxable value of land and additions on the property. | Land | Improvement |
|---|---|---|---|---|
| 2025 | $2,400 | $451,500 | $101,400 | $350,100 |
| 2024 | $2,400 | $443,900 | $88,400 | $355,500 |
| 2023 | $2,400 | $398,400 | $84,000 | $314,400 |
| 2022 | $2,299 | $414,200 | $82,400 | $331,800 |
| 2021 | $2,192 | $336,200 | $64,500 | $271,700 |
| 2020 | $2,053 | $296,800 | $64,500 | $232,300 |
| 2019 | $1,863 | $262,500 | $64,500 | $198,000 |
| 2018 | $1,613 | $236,700 | $50,100 | $186,600 |
| 2017 | $1,585 | $222,200 | $46,400 | $175,800 |
| 2016 | $1,606 | $217,600 | $46,400 | $171,200 |
| 2015 | $1,574 | $197,400 | $47,300 | $150,100 |
| 2014 | $1,397 | $171,700 | $48,400 | $123,300 |
Source: Public Records
Map
Nearby Homes
- 112 E 8680 S
- 8558 S Center St
- 8564 S 100 E
- 8522 S Solar Way Unit 8522
- 87 Pioneer Ave
- 149 E Pioneer Ave
- 8470 Solar Way
- 87 W 8710 S
- 48 E Apollo Way
- 140 W 8710 S
- 140 Paula Dr
- 136 W Freedom Ave Unit 136
- 8812 S Stratford Cir
- 36 E Opequon Rd
- 8831 S 400 E
- 412 E 8760 S
- 132 E Chambord Ct
- 136 E Chambord Ct
- 138 E Chambord Ct
- 140 E Chambord Ct
Your Personal Tour Guide
Ask me questions while you tour the home.