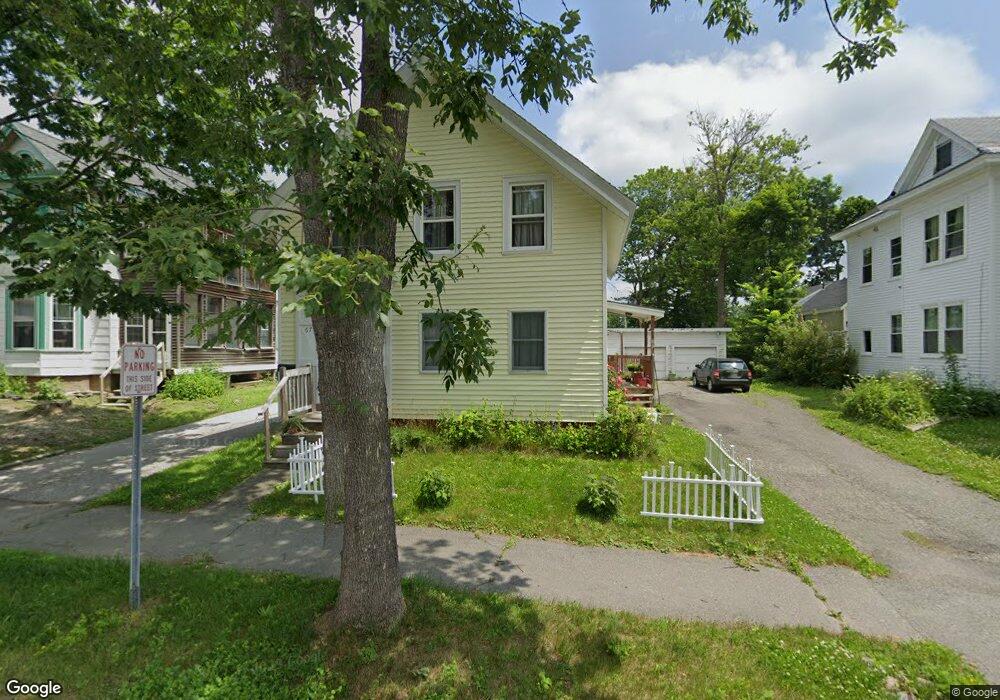
69 Maple St Bangor, ME 04401
Central Bangor NeighborhoodEstimated Value: $258,000 - $327,000
5
Beds
2
Baths
2,029
Sq Ft
$146/Sq Ft
Est. Value
About This Home
This home is located at 69 Maple St, Bangor, ME 04401 and is currently estimated at $295,367, approximately $145 per square foot. 69 Maple St is a home with nearby schools including Abraham Lincoln School, Mary Snow School, and William S. Cohen School.
Ownership History
Date
Name
Owned For
Owner Type
Purchase Details
Closed on
Sep 30, 2019
Sold by
Cote Joey W and Coleman Gary D
Bought by
Fletcher Deborah N and Thomas Fletcher G
Current Estimated Value
Home Financials for this Owner
Home Financials are based on the most recent Mortgage that was taken out on this home.
Original Mortgage
$128,000
Outstanding Balance
$112,134
Interest Rate
3.5%
Mortgage Type
New Conventional
Estimated Equity
$183,233
Create a Home Valuation Report for This Property
The Home Valuation Report is an in-depth analysis detailing your home's value as well as a comparison with similar homes in the area
Home Values in the Area
Average Home Value in this Area
Purchase History
| Date | Buyer | Sale Price | Title Company |
|---|---|---|---|
| Fletcher Deborah N | -- | -- |
Source: Public Records
Mortgage History
| Date | Status | Borrower | Loan Amount |
|---|---|---|---|
| Open | Fletcher Deborah N | $128,000 |
Source: Public Records
Tax History
| Year | Tax Paid | Tax Assessment Tax Assessment Total Assessment is a certain percentage of the fair market value that is determined by local assessors to be the total taxable value of land and additions on the property. | Land | Improvement |
|---|---|---|---|---|
| 2024 | $4,274 | $230,400 | $27,500 | $202,900 |
| 2023 | $3,872 | $202,200 | $26,400 | $175,800 |
| 2022 | $3,535 | $173,300 | $26,400 | $146,900 |
| 2021 | $3,325 | $149,100 | $24,500 | $124,600 |
| 2020 | $3,292 | $141,900 | $24,000 | $117,900 |
| 2019 | $3,142 | $136,600 | $24,000 | $112,600 |
| 2018 | $3,011 | $131,200 | $24,000 | $107,200 |
| 2017 | $2,816 | $126,300 | $24,000 | $102,300 |
| 2016 | $2,783 | $123,700 | $24,000 | $99,700 |
| 2015 | $2,715 | $123,700 | $24,000 | $99,700 |
| 2014 | $2,644 | $121,300 | $24,000 | $97,300 |
| 2013 | $2,610 | $125,500 | $24,000 | $101,500 |
Source: Public Records
Map
Nearby Homes
Your Personal Tour Guide
Ask me questions while you tour the home.