69 Maple St Roswell, GA 30075
Roswell Historic District NeighborhoodEstimated payment $12,768/month
Highlights
- Wine Cellar
- New Construction
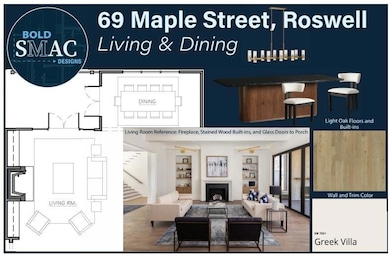
- Living Room with Fireplace
- Roswell North Elementary School Rated A
- Dining Room Seats More Than Twelve
- 5-minute walk to Roswell Town Square
About This Home
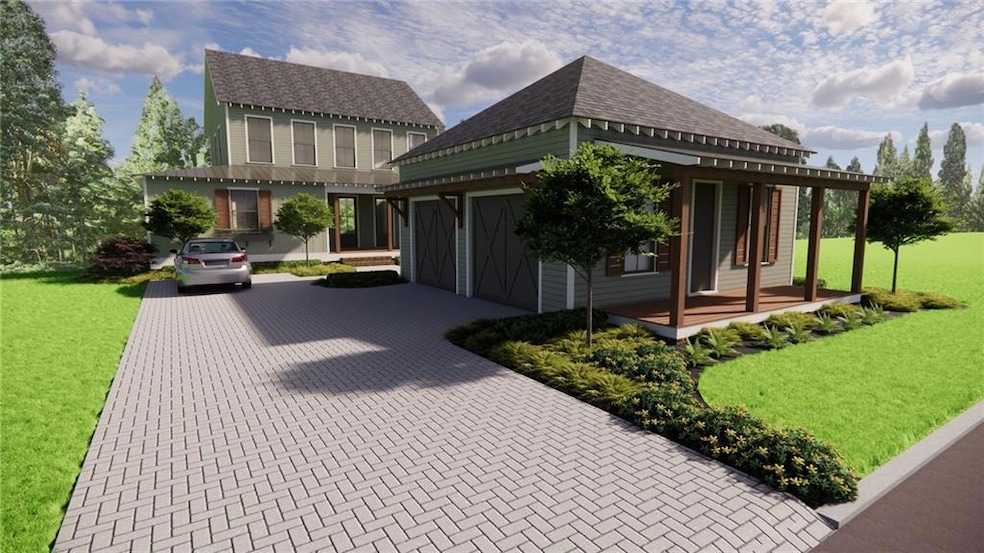
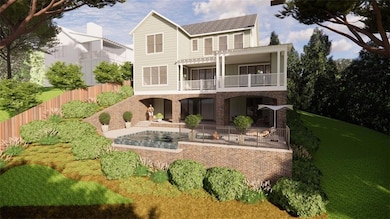
This stunning new construction in the Roswell Mill area backs up to and has direct access to Vickery Creek with gorgeous views and complete privacy, but it’s just minutes from Canton Street’s dining, shopping, and events.
From the moment you enter, a dramatic wall of windows frames sweeping views of one of Roswell’s protected nature preserves.
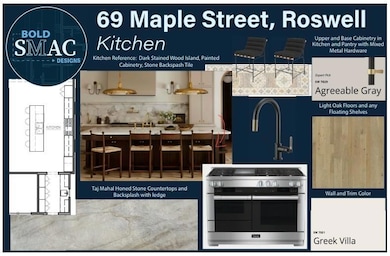
The open living space is anchored by a custom plaster fireplace, while the chef’s kitchen impresses with a grand island, gourmet appliances, a plaster vent hood, and custom cabinetry designed for both beauty and function.
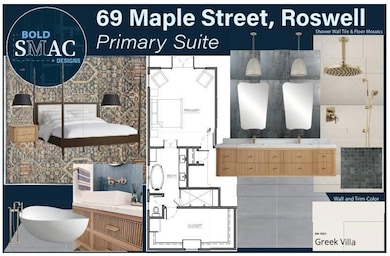
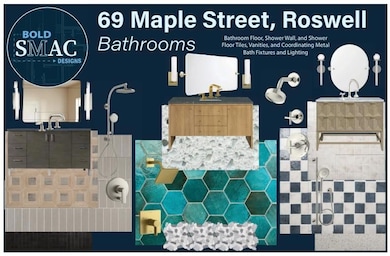
The main level primary suite offers private access to a porch with views and a spa-inspired bath featuring a soaking tub and refined finishes. Upstairs, each guest suite features its own private bathroom, ensuring a luxurious and comfortable stay.
The finished terrace level enhances the living experience with a media/playroom, bar, wine area, guest suite, and an additional half bath. Another wall of windows opens to a private brick patio overlooking nature with space for a spa/infinity pool and water feature.
A bonus room over the garage provides flexible space for a gym, office, or studio.
Every detail of this home has been crafted to maximize its extraordinary setting, from the one-of-a-kind lot with the home design to deliver a lifestyle that blends luxury, privacy, and connection to nature, all within the vibrant heart of Roswell
Home Details
Home Type
- Single Family
Est. Annual Taxes
- $1,733
Year Built
- Built in 2025 | New Construction
Lot Details
- 0.27 Acre Lot
- Cul-De-Sac
- Private Entrance
- Landscaped
- Level Lot
- Private Yard
- Front Yard
Parking
- 2 Car Attached Garage
- Parking Accessed On Kitchen Level
- Side Facing Garage
- Garage Door Opener
- Driveway Level
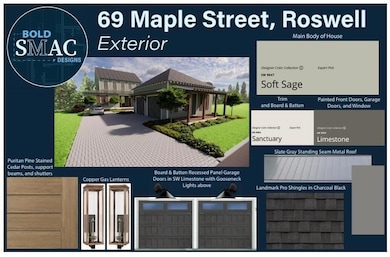
Home Design
- Cottage
- Frame Construction
- Shingle Roof
- Metal Roof
- Cement Siding
- Three Sided Brick Exterior Elevation
- Concrete Perimeter Foundation
Interior Spaces
- 5,300 Sq Ft Home
- 3-Story Property
- Bookcases
- Beamed Ceilings
- Ceiling height of 10 feet on the main level
- Ceiling Fan
- Fireplace With Gas Starter
- Fireplace Features Masonry
- Insulated Windows
- Two Story Entrance Foyer
- Wine Cellar
- Living Room with Fireplace
- 2 Fireplaces
- Dining Room Seats More Than Twelve
- Home Office
- Bonus Room
Kitchen
- Open to Family Room
- Walk-In Pantry
- Butlers Pantry
- Gas Oven
- Gas Cooktop
- Microwave
- Dishwasher
- Kitchen Island
- Stone Countertops
- Wine Rack
- Disposal
Flooring
- Wood
- Ceramic Tile
Bedrooms and Bathrooms
- 5 Bedrooms | 1 Primary Bedroom on Main
- Walk-In Closet
- Dual Vanity Sinks in Primary Bathroom
- Separate Shower in Primary Bathroom
- Soaking Tub
Laundry
- Laundry Room
- Laundry on upper level
Basement
- Basement Fills Entire Space Under The House
- Interior and Exterior Basement Entry
- Finished Basement Bathroom
- Natural lighting in basement
Home Security
- Security Lights
- Carbon Monoxide Detectors
- Fire and Smoke Detector
Outdoor Features
- Covered Patio or Porch
- Outdoor Fireplace
Location
- Property is near shops
Schools
- Roswell North Elementary School
- Crabapple Middle School
- Roswell High School
Utilities
- Central Heating and Cooling System
- Heating System Uses Natural Gas
- 220 Volts in Garage
- Electric Water Heater
- Phone Available
- Cable TV Available
Community Details
- Trails
Listing and Financial Details
- Assessor Parcel Number 12 191404151708
Map
Home Values in the Area
Average Home Value in this Area
Tax History
| Year | Tax Paid | Tax Assessment Tax Assessment Total Assessment is a certain percentage of the fair market value that is determined by local assessors to be the total taxable value of land and additions on the property. | Land | Improvement |
|---|---|---|---|---|
| 2025 | $328 | $66,360 | $66,360 | -- |
| 2024 | $328 | $66,360 | $66,360 | -- |
| 2023 | $328 | $59,960 | $59,960 | $0 |
| 2022 | $1,099 | $41,760 | $41,760 | $0 |
| 2021 | $187 | $39,680 | $39,680 | $0 |
| 2020 | $1,197 | $36,560 | $36,560 | $0 |
| 2019 | $1,119 | $34,040 | $34,040 | $0 |
| 2018 | $1,128 | $39,960 | $39,960 | $0 |
Property History
| Date | Event | Price | List to Sale | Price per Sq Ft |
|---|---|---|---|---|
| 09/19/2025 09/19/25 | For Sale | $2,400,000 | -- | $453 / Sq Ft |
Purchase History
| Date | Type | Sale Price | Title Company |
|---|---|---|---|
| Warranty Deed | -- | -- | |
| Quit Claim Deed | -- | -- | |
| Foreclosure Deed | $723,332 | -- | |
| Limited Warranty Deed | $320,000 | -- | |
| Limited Warranty Deed | $265,000 | -- |
Mortgage History
| Date | Status | Loan Amount | Loan Type |
|---|---|---|---|
| Open | $1,271,910 | New Conventional |
Source: First Multiple Listing Service (FMLS)
MLS Number: 7652366
APN: 12-1914-0415-170-8
Disclaimer: Certain information contained herein is derived from information provided by parties other than Homes.com. All information provided is deemed reliable, but is not guaranteed to be accurate and should be independently verified.
![]() Listings identified with the FMLS IDX logo come from FMLS and are held by brokerage firms other than the owner of this website. The listing brokerage is identified in any listing details. Information is deemed reliable but is not guaranteed. If you believe any FMLS listing contains material that infringes your copyrighted work please visit www.fmls.com/dmca to review our DMCA policy and learn how to submit a takedown request. © 2025 First Multiple Listing Service, Inc.
Listings identified with the FMLS IDX logo come from FMLS and are held by brokerage firms other than the owner of this website. The listing brokerage is identified in any listing details. Information is deemed reliable but is not guaranteed. If you believe any FMLS listing contains material that infringes your copyrighted work please visit www.fmls.com/dmca to review our DMCA policy and learn how to submit a takedown request. © 2025 First Multiple Listing Service, Inc.
- 53 Maple St
- 49 Sloan St
- 164 Oxbo Rd
- 220 Creek View Ln
- 755 Neel Reid Dr
- 530 Neel Reid Dr
- 310 Neel Reid Dr
- 520 Clover Ct
- 815 Maplewood Dr
- 750 Elmwood Way
- 710 Elmwood Way
- 3330 Overland Dr
- 400 Old Tree Trace
- 385 Roswell Farms Rd Unit 2
- 56 Pine St
- 0 S Atlanta St Unit 7654433
- 383 Westside Dr Unit 13
- 383 Westside Dr
- 524 Warm Springs Cir Unit Roswell Springs
- 527 Warm Springs Cir
- 3000 Forrest Walk
- 100 Chattahoochee Cir
- 1055 Alpharetta
- 322 Crestview Cir
- 1806 Liberty Ln Unit 125
- 345 Pine Grove Rd
- 880 Melody Ln Unit A
- 1180 Canton St Unit 2C1
- 1180 Canton St Unit 2B
- 1180 Canton St Unit 2B2
- 1180 Canton St
- 190 Thompson Place
- 1275 Pine Valley Ct
- 330 Lake Crest Dr
- 1500 Huntcliff Village Ct
- 330 Winding River Dr Unit F
- 400 Hanover Park Rd
- 560 Grimes Place
