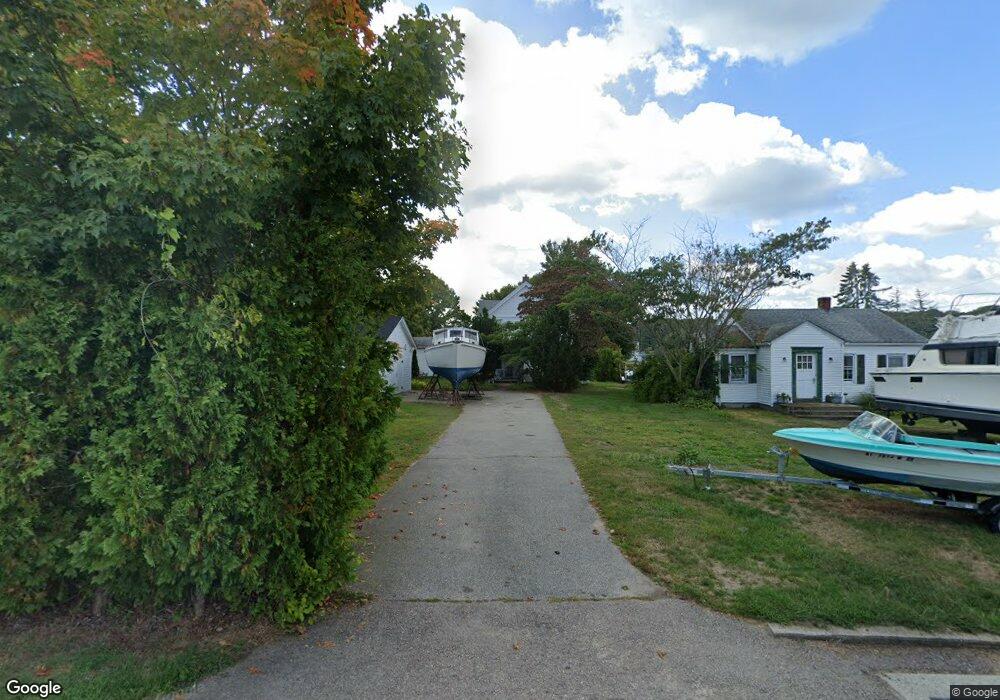
69 Margin St Westerly, RI 02891
Estimated Value: $666,000 - $865,000
3
Beds
2
Baths
2,134
Sq Ft
$358/Sq Ft
Est. Value
About This Home
This home is located at 69 Margin St, Westerly, RI 02891 and is currently estimated at $762,982, approximately $357 per square foot. 69 Margin St is a home located in Washington County with nearby schools including Westerly High School and St. Michael School.
Ownership History
Date
Name
Owned For
Owner Type
Purchase Details
Closed on
May 19, 2011
Sold by
Curtin Geoffrey G and Curtin Mary S
Bought by
Mary S Curtin T
Current Estimated Value
Purchase Details
Closed on
Jul 2, 1997
Sold by
Tobin George E
Bought by
Curtin Geoffrey G and Curtin Mary
Home Financials for this Owner
Home Financials are based on the most recent Mortgage that was taken out on this home.
Original Mortgage
$137,000
Interest Rate
7.86%
Create a Home Valuation Report for This Property
The Home Valuation Report is an in-depth analysis detailing your home's value as well as a comparison with similar homes in the area
Home Values in the Area
Average Home Value in this Area
Purchase History
| Date | Buyer | Sale Price | Title Company |
|---|---|---|---|
| Mary S Curtin T | -- | -- | |
| Curtin Geoffrey G | $187,000 | -- |
Source: Public Records
Mortgage History
| Date | Status | Borrower | Loan Amount |
|---|---|---|---|
| Open | Curtin Geoffrey G | $167,171 | |
| Previous Owner | Curtin Geoffrey G | $150,000 | |
| Previous Owner | Curtin Geoffrey G | $140,000 | |
| Previous Owner | Curtin Geoffrey G | $137,000 |
Source: Public Records
Tax History
| Year | Tax Paid | Tax Assessment Tax Assessment Total Assessment is a certain percentage of the fair market value that is determined by local assessors to be the total taxable value of land and additions on the property. | Land | Improvement |
|---|---|---|---|---|
| 2025 | $6,457 | $830,000 | $553,300 | $276,700 |
| 2024 | $6,359 | $608,500 | $395,400 | $213,100 |
| 2023 | $6,182 | $608,500 | $395,400 | $213,100 |
| 2022 | $6,146 | $608,500 | $395,400 | $213,100 |
| 2021 | $6,161 | $510,900 | $343,600 | $167,300 |
| 2020 | $6,054 | $510,900 | $343,600 | $167,300 |
| 2019 | $5,998 | $510,900 | $343,600 | $167,300 |
| 2018 | $5,893 | $477,200 | $326,500 | $150,700 |
| 2017 | $5,726 | $477,200 | $326,500 | $150,700 |
| 2016 | $5,726 | $477,200 | $326,500 | $150,700 |
| 2015 | $5,490 | $488,900 | $332,900 | $156,000 |
| 2014 | $5,402 | $488,900 | $332,900 | $156,000 |
Source: Public Records
Map
Nearby Homes
- 38 Prospect St Unit B
- 23 Abbey Ln Unit 12
- 24 Abbey Ln Unit 13
- 19 Crestview Dr Unit C
- 21 North Dr
- 25 School St Unit 2
- 28 Elaine St
- 13 Moss St
- 16 Spring St
- 174 River Rd
- 19 Lathrop Ave
- 14 George St
- 141 W Broad St
- 12 Butterfly Dr
- 39 Summertime Cir
- 41 Summertime Cir Unit 41
- 27 Summertime Cir
- 38 Summertime Cir
- 22 Summertime Cir
- 23 Summertime Cir
Your Personal Tour Guide
Ask me questions while you tour the home.