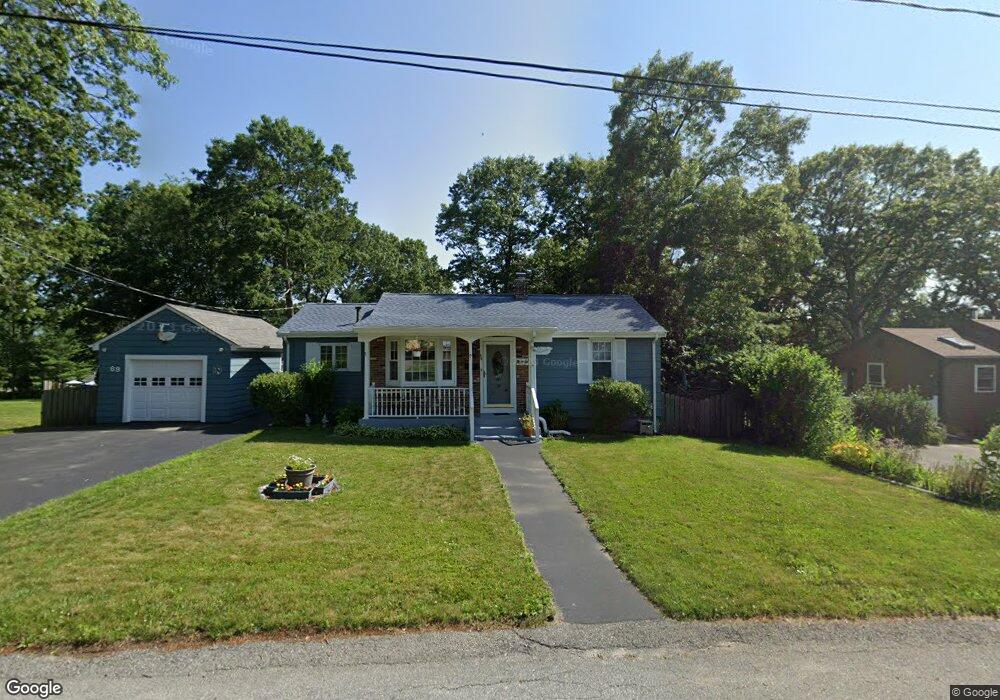
69 Massey Rd Tiverton, RI 02878
North Tiverton NeighborhoodEstimated Value: $429,000 - $489,000
3
Beds
2
Baths
1,190
Sq Ft
$385/Sq Ft
Est. Value
About This Home
This home is located at 69 Massey Rd, Tiverton, RI 02878 and is currently estimated at $458,017, approximately $384 per square foot. 69 Massey Rd is a home located in Newport County with nearby schools including Tiverton High School, Argosy Collegiate Charter School, and Saint Stanislaus School.
Ownership History
Date
Name
Owned For
Owner Type
Purchase Details
Closed on
Dec 2, 2024
Sold by
Carreiro Mary C
Bought by
Bishop Judith C and Carreiro Lynn
Current Estimated Value
Purchase Details
Closed on
Nov 14, 2024
Sold by
Carreiro Ernest J and Carreiro Mary C
Bought by
Carreiro Mary C
Purchase Details
Closed on
Nov 15, 1966
Bought by
Carreiro Ernest J and Carreiro Mary C
Create a Home Valuation Report for This Property
The Home Valuation Report is an in-depth analysis detailing your home's value as well as a comparison with similar homes in the area
Home Values in the Area
Average Home Value in this Area
Purchase History
| Date | Buyer | Sale Price | Title Company |
|---|---|---|---|
| Bishop Judith C | -- | None Available | |
| Bishop Judith C | -- | None Available | |
| Bishop Judith C | -- | None Available | |
| Carreiro Mary C | -- | None Available | |
| Carreiro Mary C | -- | None Available | |
| Carreiro Mary C | -- | None Available | |
| Carreiro Ernest J | -- | -- |
Source: Public Records
Tax History Compared to Growth
Tax History
| Year | Tax Paid | Tax Assessment Tax Assessment Total Assessment is a certain percentage of the fair market value that is determined by local assessors to be the total taxable value of land and additions on the property. | Land | Improvement |
|---|---|---|---|---|
| 2025 | $3,556 | $321,800 | $111,600 | $210,200 |
| 2024 | $3,556 | $321,800 | $111,600 | $210,200 |
| 2023 | $3,564 | $239,200 | $104,200 | $135,000 |
| 2022 | $3,499 | $239,200 | $104,200 | $135,000 |
| 2021 | $3,413 | $239,200 | $104,200 | $135,000 |
| 2020 | $3,165 | $195,500 | $76,700 | $118,800 |
| 2019 | $3,087 | $195,500 | $76,700 | $118,800 |
| 2018 | $3,204 | $195,500 | $76,700 | $118,800 |
| 2017 | $3,008 | $157,900 | $74,100 | $83,800 |
| 2016 | $3,022 | $157,900 | $74,100 | $83,800 |
| 2015 | $3,022 | $157,900 | $74,100 | $83,800 |
| 2014 | $3,310 | $171,500 | $71,200 | $100,300 |
Source: Public Records
Map
Nearby Homes