Estimated Value: $238,000 - $271,000
3
Beds
1
Bath
1,218
Sq Ft
$207/Sq Ft
Est. Value
About This Home
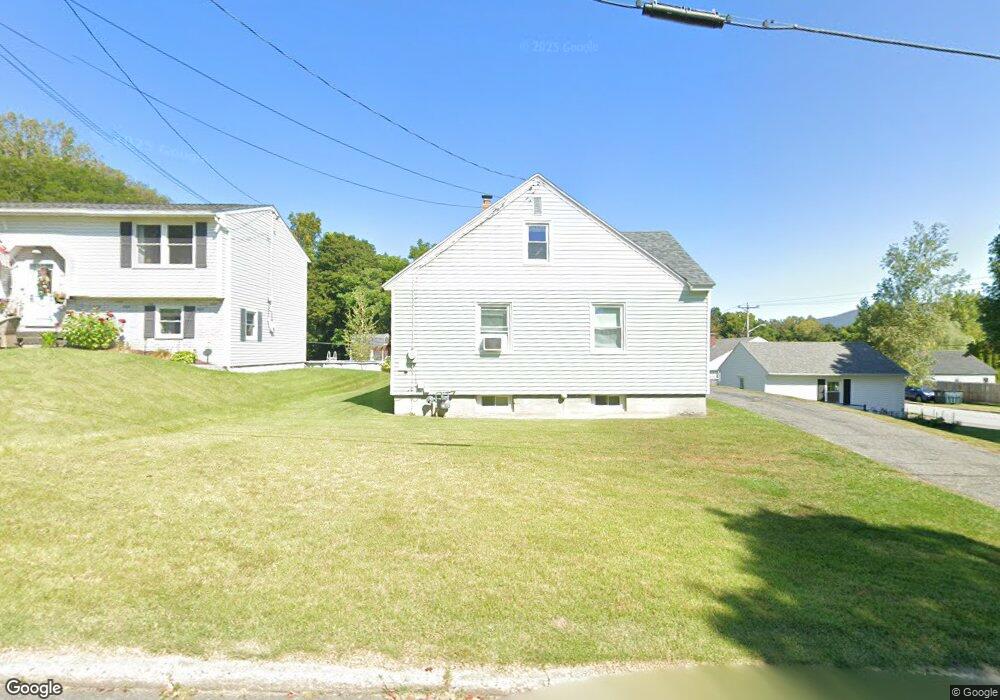
This home is located at 69 Melrose St, Adams, MA 01220 and is currently estimated at $252,086, approximately $206 per square foot. 69 Melrose St is a home located in Berkshire County with nearby schools including Hoosac Valley Middle & High School, Berkshire Arts & Technology Charter Public School, and St. Stanislaus Kostka School.
Ownership History
Date
Name
Owned For
Owner Type
Purchase Details
Closed on
May 7, 2004
Sold by
Starsiak Edward J
Bought by
Macdonald Donna M
Current Estimated Value
Home Financials for this Owner
Home Financials are based on the most recent Mortgage that was taken out on this home.
Original Mortgage
$104,025
Outstanding Balance
$48,395
Interest Rate
5.39%
Mortgage Type
Purchase Money Mortgage
Estimated Equity
$203,691
Create a Home Valuation Report for This Property
The Home Valuation Report is an in-depth analysis detailing your home's value as well as a comparison with similar homes in the area
Home Values in the Area
Average Home Value in this Area
Purchase History
| Date | Buyer | Sale Price | Title Company |
|---|---|---|---|
| Macdonald Donna M | $109,500 | -- |
Source: Public Records
Mortgage History
| Date | Status | Borrower | Loan Amount |
|---|---|---|---|
| Open | Macdonald Donna M | $104,025 |
Source: Public Records
Tax History Compared to Growth
Tax History
| Year | Tax Paid | Tax Assessment Tax Assessment Total Assessment is a certain percentage of the fair market value that is determined by local assessors to be the total taxable value of land and additions on the property. | Land | Improvement |
|---|---|---|---|---|
| 2025 | $3,077 | $180,900 | $53,600 | $127,300 |
| 2024 | $2,908 | $165,800 | $50,400 | $115,400 |
| 2023 | $2,712 | $146,200 | $45,800 | $100,400 |
| 2022 | $2,643 | $126,500 | $39,800 | $86,700 |
| 2021 | $2,610 | $115,400 | $39,800 | $75,600 |
| 2020 | $2,490 | $113,800 | $39,800 | $74,000 |
| 2019 | $2,434 | $113,800 | $39,800 | $74,000 |
| 2018 | $2,499 | $112,500 | $39,800 | $72,700 |
| 2017 | $2,404 | $112,500 | $39,800 | $72,700 |
| 2016 | $2,334 | $109,100 | $39,800 | $69,300 |
| 2015 | $2,387 | $111,700 | $35,000 | $76,700 |
| 2014 | $2,228 | $111,700 | $35,000 | $76,700 |
Source: Public Records
Map
Nearby Homes
- 3 Melrose St
- 9 Beecher St
- 2 Melrose St
- 71 Park St Unit 75
- 2 Valley St
- 10 Enterprise St
- 13 Water St
- 50 Commercial St
- 4 Edmunds St Unit A101
- 30 Summer St
- 6 Crandall St
- 16-18 E Hoosac St
- 29 Crandall St
- 56-58 Columbia St
- 5 Richmond St
- 34-36 Crandall St
- 0 Friend St
- 219 West Rd
- 17 Morningside Ave
- 27 2nd St