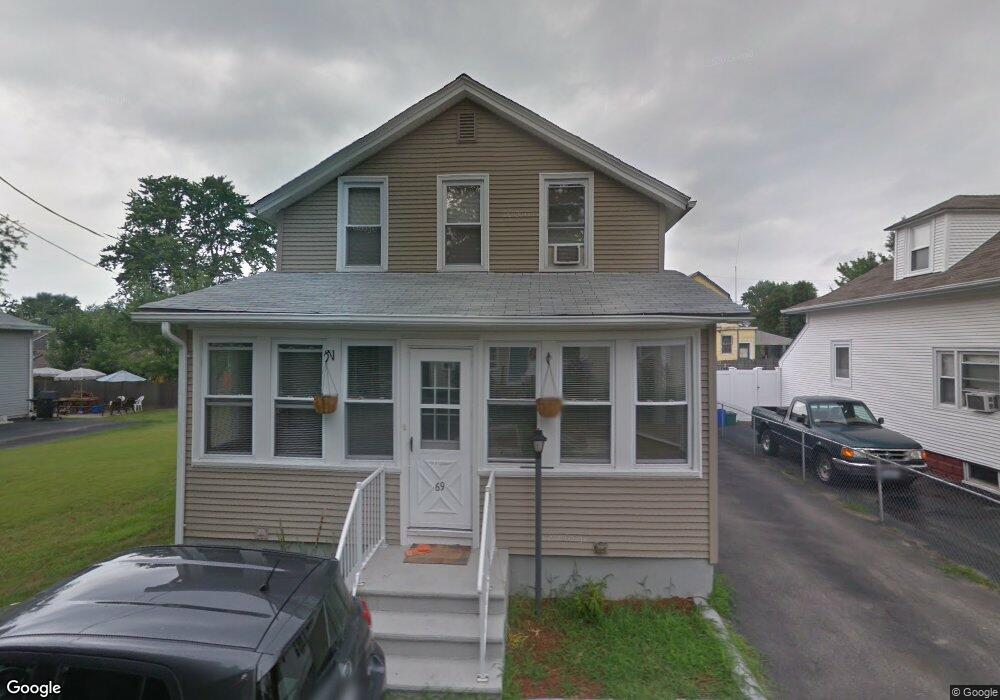
69 Middle St Riverside, RI 02915
Riverside NeighborhoodEstimated Value: $328,000 - $415,000
4
Beds
1
Bath
1,139
Sq Ft
$341/Sq Ft
Est. Value
About This Home
This home is located at 69 Middle St, Riverside, RI 02915 and is currently estimated at $388,644, approximately $341 per square foot. 69 Middle St is a home located in Providence County with nearby schools including East Providence High School, St Mary Academy-Bay View, and St Luke Elementary School.
Ownership History
Date
Name
Owned For
Owner Type
Purchase Details
Closed on
Oct 29, 2010
Sold by
Wells Fargo Bk
Bought by
Constant Jessica L
Current Estimated Value
Home Financials for this Owner
Home Financials are based on the most recent Mortgage that was taken out on this home.
Original Mortgage
$89,900
Outstanding Balance
$59,445
Interest Rate
4.39%
Mortgage Type
Purchase Money Mortgage
Estimated Equity
$329,199
Purchase Details
Closed on
Jun 3, 2009
Sold by
Beaudry Debra A and Wells Fargo Bank Na
Bought by
Wells Fargo Bank Na
Purchase Details
Closed on
Jul 8, 1997
Sold by
Oliveira George and Oliveira Mary
Bought by
Beaudry Michael and Beaudry Debra
Create a Home Valuation Report for This Property
The Home Valuation Report is an in-depth analysis detailing your home's value as well as a comparison with similar homes in the area
Home Values in the Area
Average Home Value in this Area
Purchase History
| Date | Buyer | Sale Price | Title Company |
|---|---|---|---|
| Constant Jessica L | $100,000 | -- | |
| Wells Fargo Bank Na | $200,000 | -- | |
| Beaudry Michael | $67,000 | -- | |
| Constant Jessica L | $100,000 | -- | |
| Wells Fargo Bank Na | $200,000 | -- | |
| Beaudry Michael | $67,000 | -- |
Source: Public Records
Mortgage History
| Date | Status | Borrower | Loan Amount |
|---|---|---|---|
| Open | Beaudry Michael | $20,000 | |
| Open | Beaudry Michael | $89,900 |
Source: Public Records
Tax History
| Year | Tax Paid | Tax Assessment Tax Assessment Total Assessment is a certain percentage of the fair market value that is determined by local assessors to be the total taxable value of land and additions on the property. | Land | Improvement |
|---|---|---|---|---|
| 2025 | $4,695 | $359,200 | $80,400 | $278,800 |
| 2024 | $4,182 | $272,800 | $67,000 | $205,800 |
| 2023 | $4,027 | $272,800 | $67,000 | $205,800 |
| 2022 | $4,134 | $189,100 | $48,200 | $140,900 |
| 2021 | $4,066 | $189,100 | $47,100 | $142,000 |
| 2020 | $3,894 | $189,100 | $47,100 | $142,000 |
| 2019 | $3,786 | $189,100 | $47,100 | $142,000 |
| 2018 | $3,620 | $158,200 | $47,200 | $111,000 |
| 2017 | $3,539 | $158,200 | $47,200 | $111,000 |
| 2016 | $3,522 | $158,200 | $47,200 | $111,000 |
| 2015 | $3,502 | $152,600 | $48,100 | $104,500 |
| 2014 | $3,502 | $152,600 | $48,100 | $104,500 |
Source: Public Records
Map
Nearby Homes
- 72 Stowe Ave
- 33 Pine St Unit 35
- 129 Shore Rd
- 28 Jefferson Ave
- 41 White Ave
- 103 Burnside Ave
- 25 Arnold St
- 151 Willett Ave Unit 2
- 10 Booth Ave
- 14 Winthrop St
- 15 Claire St
- 0 Carousel Dr
- 43 Bullocks Point Ave Unit 4A
- 25 Winslow St
- 33 Bullocks Point Ave Unit 5C
- 14 Benedict St
- 25 Bullocks Point Ave Unit 5C
- 6 Fuller Ave
- 916 Bullocks Pt Ave
- 85 Hilton Ave
Your Personal Tour Guide
Ask me questions while you tour the home.