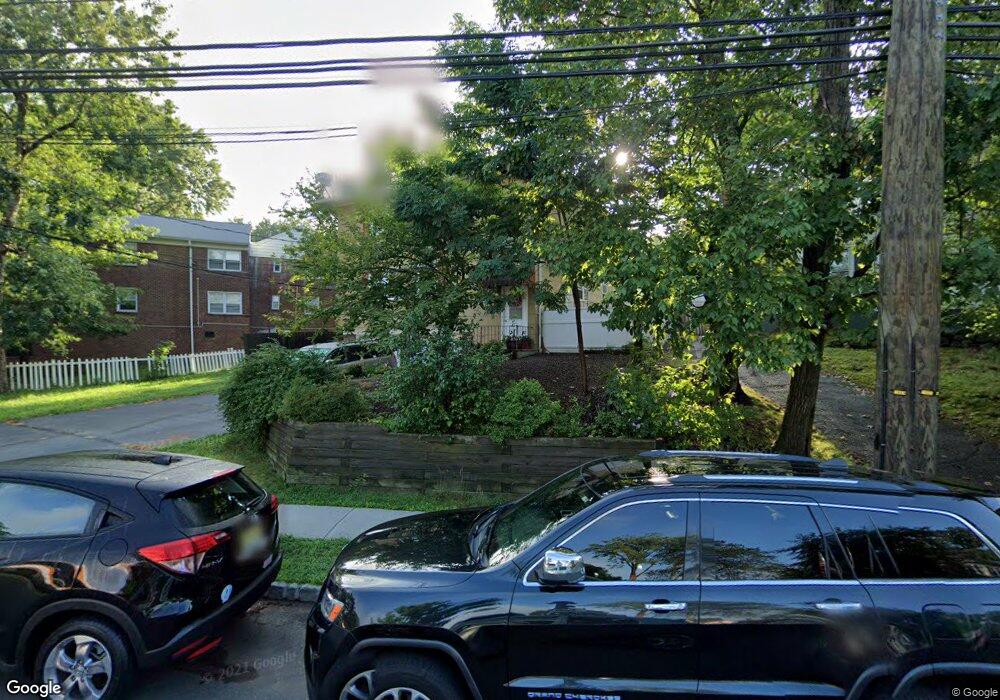
69 Mississippi Ave Unit 2 West Orange, NJ 07052
Estimated Value: $659,000 - $845,000
3
Beds
2
Baths
2,700
Sq Ft
$289/Sq Ft
Est. Value
About This Home
This home is located at 69 Mississippi Ave Unit 2, West Orange, NJ 07052 and is currently estimated at $780,481, approximately $289 per square foot. 69 Mississippi Ave Unit 2 is a home located in Essex County with nearby schools including West Orange High School and Mount Carmel Guild Academy.
Ownership History
Date
Name
Owned For
Owner Type
Purchase Details
Closed on
Nov 21, 2024
Sold by
Campbell Devon
Bought by
Sobanjo David O and Sobanjo Joseph O
Current Estimated Value
Home Financials for this Owner
Home Financials are based on the most recent Mortgage that was taken out on this home.
Original Mortgage
$620,000
Outstanding Balance
$614,191
Interest Rate
6.44%
Mortgage Type
New Conventional
Estimated Equity
$166,290
Purchase Details
Closed on
Jul 12, 2011
Sold by
Vansinh D and Van Kathy T
Bought by
Campbell Devon G
Home Financials for this Owner
Home Financials are based on the most recent Mortgage that was taken out on this home.
Original Mortgage
$272,902
Interest Rate
4.51%
Mortgage Type
FHA
Purchase Details
Closed on
Oct 12, 1999
Sold by
The Friedman Group
Bought by
Van Sinh and Kathy Van +
Home Financials for this Owner
Home Financials are based on the most recent Mortgage that was taken out on this home.
Original Mortgage
$198,000
Interest Rate
7.78%
Create a Home Valuation Report for This Property
The Home Valuation Report is an in-depth analysis detailing your home's value as well as a comparison with similar homes in the area
Home Values in the Area
Average Home Value in this Area
Purchase History
| Date | Buyer | Sale Price | Title Company |
|---|---|---|---|
| Sobanjo David O | $775,000 | The Security Title Guarantee | |
| Campbell Devon G | $280,000 | Multiple | |
| Van Sinh | $220,000 | -- |
Source: Public Records
Mortgage History
| Date | Status | Borrower | Loan Amount |
|---|---|---|---|
| Open | Sobanjo David O | $620,000 | |
| Previous Owner | Campbell Devon G | $272,902 | |
| Previous Owner | Van Sinh | $198,000 |
Source: Public Records
Tax History Compared to Growth
Tax History
| Year | Tax Paid | Tax Assessment Tax Assessment Total Assessment is a certain percentage of the fair market value that is determined by local assessors to be the total taxable value of land and additions on the property. | Land | Improvement |
|---|---|---|---|---|
| 2025 | $12,645 | $566,400 | $180,900 | $385,500 |
| 2024 | $12,645 | $275,000 | $102,100 | $172,900 |
| 2022 | $12,202 | $275,000 | $102,100 | $172,900 |
| 2021 | $11,974 | $275,000 | $102,100 | $172,900 |
| 2020 | $11,781 | $275,000 | $102,100 | $172,900 |
| 2019 | $11,443 | $275,000 | $102,100 | $172,900 |
| 2018 | $11,105 | $275,000 | $102,100 | $172,900 |
| 2017 | $10,962 | $275,000 | $102,100 | $172,900 |
| 2016 | $10,698 | $275,000 | $102,100 | $172,900 |
| 2015 | $10,497 | $275,000 | $102,100 | $172,900 |
| 2014 | $10,291 | $275,000 | $102,100 | $172,900 |
Source: Public Records
Map
Nearby Homes
- 3 Winfield St
- 17 Parkside Ave
- 194 Harrison Ave
- 77 Harrison Ave Unit 79
- 175 Harrison Ave
- 79 Harrison Ave
- 7 Virginia Ave
- 102 Harrison Ave
- 7 Franklin Ave
- 5 Franklin Ave
- 24 Mountain Ave
- 42 Franklin Place
- 2 Fremont St
- 104 Harrison Ave
- 1104 Smith Manor Blvd
- 70 Llewellyn Rd
- 1102 Smith Manor Blvd Unit 52
- 29 Enfield Ave
- 6 Lynwood Way
- 350 Main St
- 69 Mississippi Ave Unit 1
- 69 Mississippi Ave Unit Floor 1
- 69 Mississippi Ave
- 67 Mississippi Ave
- 66 Mississippi Ave
- 7 Robert Ct Unit E
- 7 Robert Ct
- 7 Robert Ct Unit E3
- 7 Robert Ct Unit D
- 64 Mississippi Ave
- 63 Mississippi Ave
- 63 Mississippi Ave Unit 3
- 62 Mississippi Ave
- 1 Robert Ct
- 60 Mississippi Ave
- 59 Mississippi Ave
- 59 Mississippi Ave Unit 1
- 5 Susan Ct Unit B1
- 6 Robert Ct Unit B3
- 58 Mississippi Ave