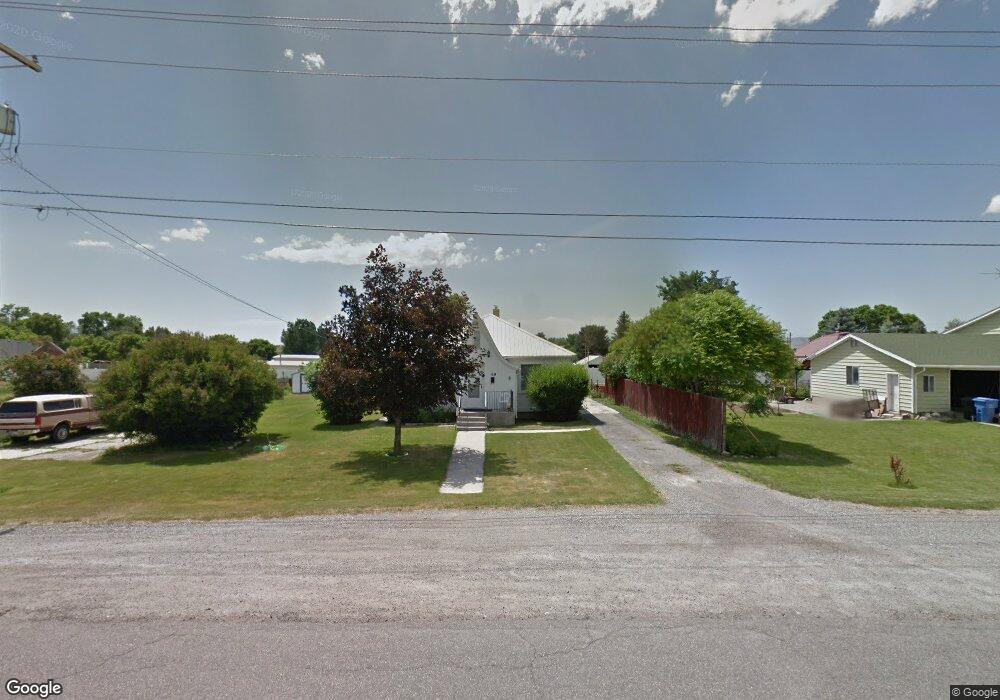
69 N 200 W Smithfield, UT 84335
Estimated Value: $421,000 - $450,000
4
Beds
2
Baths
2,210
Sq Ft
$196/Sq Ft
Est. Value
About This Home
This home is located at 69 N 200 W, Smithfield, UT 84335 and is currently estimated at $432,691, approximately $195 per square foot. 69 N 200 W is a home located in Cache County with nearby schools including Summit School, North Cache Middle School, and White Pine Middle School.
Ownership History
Date
Name
Owned For
Owner Type
Purchase Details
Closed on
May 6, 2021
Sold by
Hansen Adam R
Bought by
Hansen Adam R and Hansen Hanna Lynn
Current Estimated Value
Purchase Details
Closed on
Apr 30, 2020
Sold by
Cache Home Investments Llc
Bought by
Hansen Adam R
Home Financials for this Owner
Home Financials are based on the most recent Mortgage that was taken out on this home.
Original Mortgage
$275,252
Outstanding Balance
$244,235
Interest Rate
3.6%
Mortgage Type
New Conventional
Estimated Equity
$188,456
Purchase Details
Closed on
Nov 13, 2019
Sold by
Duncan John William and Merrill Cathy Ann
Bought by
Cache Home Investments Llc
Create a Home Valuation Report for This Property
The Home Valuation Report is an in-depth analysis detailing your home's value as well as a comparison with similar homes in the area
Home Values in the Area
Average Home Value in this Area
Purchase History
| Date | Buyer | Sale Price | Title Company |
|---|---|---|---|
| Hansen Adam R | -- | American Secure Title Logan | |
| Hansen Adam R | -- | Hickman Land Title Co | |
| Cache Home Investments Llc | -- | Hickman Land Title Co |
Source: Public Records
Mortgage History
| Date | Status | Borrower | Loan Amount |
|---|---|---|---|
| Open | Hansen Adam R | $275,252 |
Source: Public Records
Tax History
| Year | Tax Paid | Tax Assessment Tax Assessment Total Assessment is a certain percentage of the fair market value that is determined by local assessors to be the total taxable value of land and additions on the property. | Land | Improvement |
|---|---|---|---|---|
| 2025 | $1,753 | $234,610 | $0 | $0 |
| 2024 | $1,832 | $230,040 | $0 | $0 |
| 2023 | $1,934 | $229,690 | $0 | $0 |
| 2022 | $1,988 | $232,295 | $0 | $0 |
| 2021 | $1,802 | $321,680 | $70,000 | $251,680 |
| 2020 | $1,583 | $263,600 | $70,000 | $193,600 |
| 2019 | $1,228 | $194,968 | $45,000 | $149,968 |
| 2018 | $1,165 | $178,900 | $45,000 | $133,900 |
| 2017 | $880 | $73,810 | $0 | $0 |
| 2016 | $896 | $73,810 | $0 | $0 |
| 2015 | $899 | $73,810 | $0 | $0 |
| 2014 | $882 | $73,810 | $0 | $0 |
| 2013 | -- | $73,810 | $0 | $0 |
Source: Public Records
Map
Nearby Homes
Your Personal Tour Guide
Ask me questions while you tour the home.