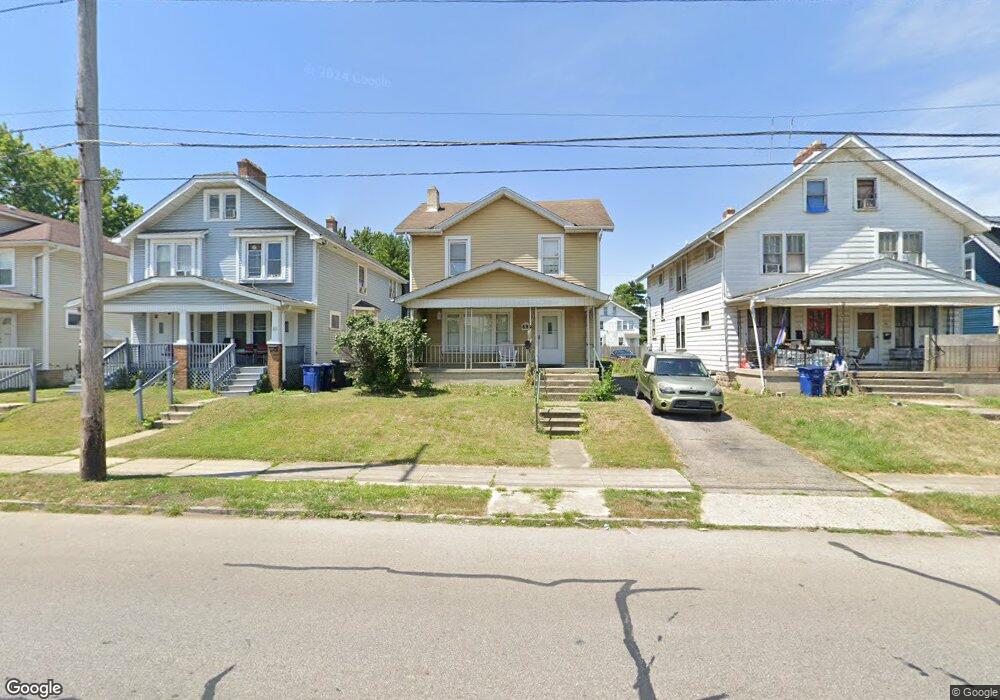
69 N Hague Ave Columbus, OH 43204
North Hilltop NeighborhoodEstimated Value: $137,000 - $182,000
3
Beds
1
Bath
1,352
Sq Ft
$116/Sq Ft
Est. Value
About This Home
This home is located at 69 N Hague Ave, Columbus, OH 43204 and is currently estimated at $157,410, approximately $116 per square foot. 69 N Hague Ave is a home located in Franklin County with nearby schools including West Broad Elementary School, Westmoor Middle School, and West High School.
Ownership History
Date
Name
Owned For
Owner Type
Purchase Details
Closed on
Aug 6, 2020
Sold by
Trojack Kevin M and Trojack Kevin
Bought by
Trojack Rentals Llc
Current Estimated Value
Purchase Details
Closed on
Oct 24, 2016
Sold by
Cogent Investment Group Llc
Bought by
Trojack Kevin
Purchase Details
Closed on
Mar 24, 2009
Sold by
Realistic Investors Llc
Bought by
Cogent Investment Group Llc
Purchase Details
Closed on
Aug 18, 2008
Sold by
Fannie Mae
Bought by
Realistic Investors Llc
Home Financials for this Owner
Home Financials are based on the most recent Mortgage that was taken out on this home.
Original Mortgage
$56,000
Interest Rate
6.42%
Mortgage Type
Purchase Money Mortgage
Purchase Details
Closed on
Dec 18, 2007
Sold by
Jenkins Billie H and Citimortgage Inc
Bought by
Federal National Mortgage Association
Purchase Details
Closed on
Jun 22, 2006
Sold by
Jenkins Billie H and Jenkins Alice M
Bought by
Jenkins Billie H and Jenkins Alice M
Purchase Details
Closed on
Jul 20, 1971
Bought by
Jenkins Billie H
Create a Home Valuation Report for This Property
The Home Valuation Report is an in-depth analysis detailing your home's value as well as a comparison with similar homes in the area
Home Values in the Area
Average Home Value in this Area
Purchase History
| Date | Buyer | Sale Price | Title Company |
|---|---|---|---|
| Trojack Rentals Llc | -- | None Available | |
| Trojack Kevin | $10,000 | None Available | |
| Cogent Investment Group Llc | $249,500 | Fati | |
| Realistic Investors Llc | $30,000 | None Available | |
| Federal National Mortgage Association | $50,000 | None Available | |
| Jenkins Billie H | -- | None Available | |
| Jenkins Billie H | -- | -- |
Source: Public Records
Mortgage History
| Date | Status | Borrower | Loan Amount |
|---|---|---|---|
| Previous Owner | Realistic Investors Llc | $56,000 |
Source: Public Records
Tax History Compared to Growth
Tax History
| Year | Tax Paid | Tax Assessment Tax Assessment Total Assessment is a certain percentage of the fair market value that is determined by local assessors to be the total taxable value of land and additions on the property. | Land | Improvement |
|---|---|---|---|---|
| 2024 | $1,864 | $40,680 | $5,780 | $34,900 |
| 2023 | $1,841 | $40,670 | $5,775 | $34,895 |
| 2022 | $222 | $4,170 | $2,070 | $2,100 |
| 2021 | $222 | $4,170 | $2,070 | $2,100 |
| 2020 | $222 | $4,170 | $2,070 | $2,100 |
| 2019 | $218 | $3,500 | $1,750 | $1,750 |
| 2018 | $927 | $3,500 | $1,750 | $1,750 |
| 2017 | $1,067 | $3,500 | $1,750 | $1,750 |
| 2016 | $1,826 | $24,010 | $5,390 | $18,620 |
| 2015 | $1,636 | $24,010 | $5,390 | $18,620 |
| 2014 | $1,489 | $24,010 | $5,390 | $18,620 |
| 2013 | $1,062 | $28,245 | $6,335 | $21,910 |
Source: Public Records
Map
Nearby Homes
- 104-106 N Hague Ave
- 65 N Chase Ave
- 87 N Warren Ave
- 166 N Harris Ave
- 65 S Hague Ave
- 200-202 N Harris Ave
- 162 S Roys Ave
- 118 N Ogden Ave
- 184 N Roys Ave
- 85 S Warren Ave
- 127 N Burgess Ave
- 78 N Burgess Ave
- 58 Binns Blvd
- 154-156 N Huron Ave
- 75 N Terrace Ave
- 75 N Huron Ave
- 66 N Burgess Ave
- 2710 Palmetto St
- 227 S Hague Ave
- 235 S Harris Ave
- 63 N Hague Ave Unit 65
- 63 N Hague Ave Unit 63-65
- 63-65 N Hague Ave
- 59 N Hague Ave
- 79 N Hague Ave
- 51 N Hague Ave Unit 53
- 51-53 N Hague Ave
- 45 N Hague Ave Unit 2
- 64 N Powell Ave
- 68-70 N Powell Ave
- 45-47 N Hague Ave
- 68 N Powell Ave Unit 70
- 91 N Hague Ave
- 91 S Hague Ave
- 74 N Powell Ave Unit 76
- 54 N Powell Ave
- 39 N Hague Ave
- 48 N Powell Ave
- 33 N Hague Ave
- 92 N Powell Ave