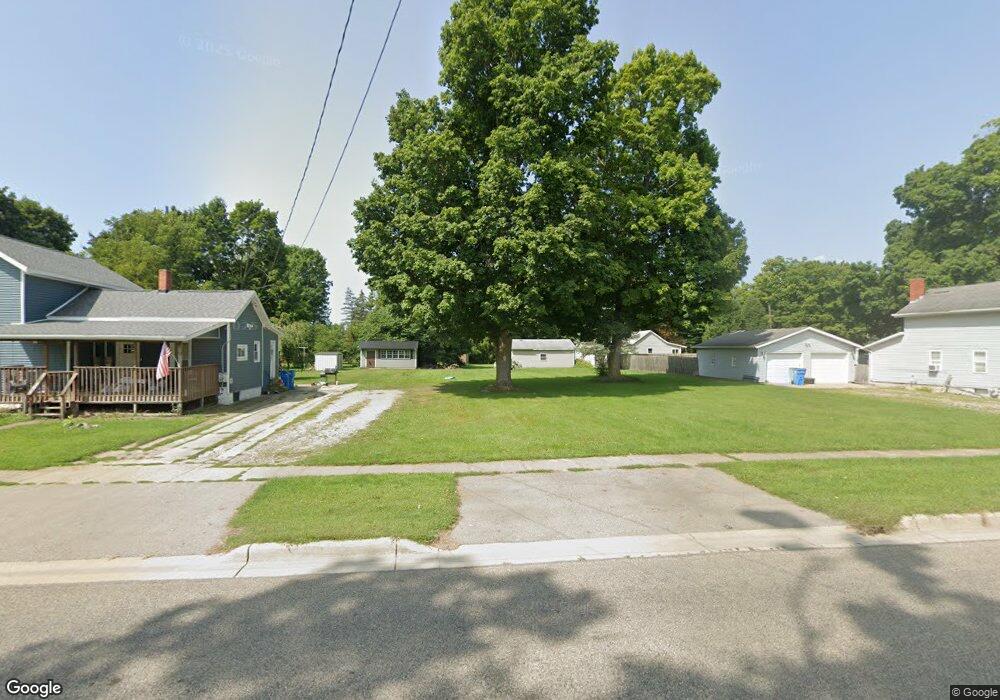
69 N Main St Quincy, MI 49082
Estimated Value: $161,000 - $166,767
2
Beds
1
Bath
1,467
Sq Ft
$111/Sq Ft
Est. Value
About This Home
This home is located at 69 N Main St, Quincy, MI 49082 and is currently estimated at $162,942, approximately $111 per square foot. 69 N Main St is a home located in Branch County with nearby schools including Jennings Elementary School, Quincy Middle School, and Quincy High School.
Ownership History
Date
Name
Owned For
Owner Type
Purchase Details
Closed on
Aug 29, 2023
Sold by
Nickerson Caleb D and Nickerson Audra L
Bought by
Maddie Michael
Current Estimated Value
Home Financials for this Owner
Home Financials are based on the most recent Mortgage that was taken out on this home.
Original Mortgage
$158,333
Outstanding Balance
$154,879
Interest Rate
6.81%
Mortgage Type
New Conventional
Estimated Equity
$8,063
Purchase Details
Closed on
May 12, 2016
Sold by
Gilchrest Eric J and Gilchrest Pamela S
Bought by
Nickerson Caleb D and Nickerson Audra L
Home Financials for this Owner
Home Financials are based on the most recent Mortgage that was taken out on this home.
Original Mortgage
$65,192
Interest Rate
3.71%
Mortgage Type
New Conventional
Purchase Details
Closed on
Dec 29, 2005
Sold by
Chase Bank Usa Na
Bought by
Citibank Na
Purchase Details
Closed on
Dec 22, 2005
Sold by
Slack Kelly Sue and Slack Dale
Bought by
Chase Bank Usa Na
Purchase Details
Closed on
Oct 14, 1994
Sold by
Slack Dale and Kelly Sue
Create a Home Valuation Report for This Property
The Home Valuation Report is an in-depth analysis detailing your home's value as well as a comparison with similar homes in the area
Home Values in the Area
Average Home Value in this Area
Purchase History
| Date | Buyer | Sale Price | Title Company |
|---|---|---|---|
| Maddie Michael | $156,750 | None Listed On Document | |
| Nickerson Caleb D | $63,400 | Branch County Abstract & Tit | |
| Citibank Na | -- | None Available | |
| Chase Bank Usa Na | $74,992 | None Available | |
| -- | -- | -- |
Source: Public Records
Mortgage History
| Date | Status | Borrower | Loan Amount |
|---|---|---|---|
| Open | Maddie Michael | $158,333 | |
| Previous Owner | Nickerson Caleb D | $65,192 |
Source: Public Records
Tax History Compared to Growth
Tax History
| Year | Tax Paid | Tax Assessment Tax Assessment Total Assessment is a certain percentage of the fair market value that is determined by local assessors to be the total taxable value of land and additions on the property. | Land | Improvement |
|---|---|---|---|---|
| 2025 | $1,957 | $61,317 | $0 | $0 |
| 2024 | $1,699 | $66,042 | $0 | $0 |
| 2023 | $771 | $64,128 | $0 | $0 |
| 2022 | $771 | $50,866 | $0 | $0 |
| 2021 | -- | $46,575 | $0 | $0 |
| 2020 | -- | $44,913 | $0 | $0 |
| 2019 | -- | $35,000 | $0 | $0 |
| 2018 | -- | $25,051 | $0 | $0 |
| 2017 | -- | $29,260 | $0 | $0 |
| 2016 | -- | $31,246 | $0 | $0 |
| 2015 | -- | $28,477 | $0 | $0 |
| 2014 | -- | $24,672 | $0 | $0 |
| 2013 | -- | $22,746 | $0 | $0 |
Source: Public Records
Map
Nearby Homes
- 69 N Main St
- 1014 Aguadero Pkwy
- 9 Cole St
- 34 Park St
- 42 W Chicago St
- 46 W Chicago St
- 34 W Liberty St
- 78 Taylor St
- 44 Berry St
- 1085 E Chicago Rd Unit B
- 1085 E Chicago Rd Unit A
- 1085 E Chicago Rd
- 424 Doris St
- 912 Beckwith Shore
- 988 Williams Dr
- 216 Sandalwood Dr
- 0 Wildwood Rd
- 732 Cambridge Dr
- 4251 Squires Rd
- 808 Rolling Meadows Dr