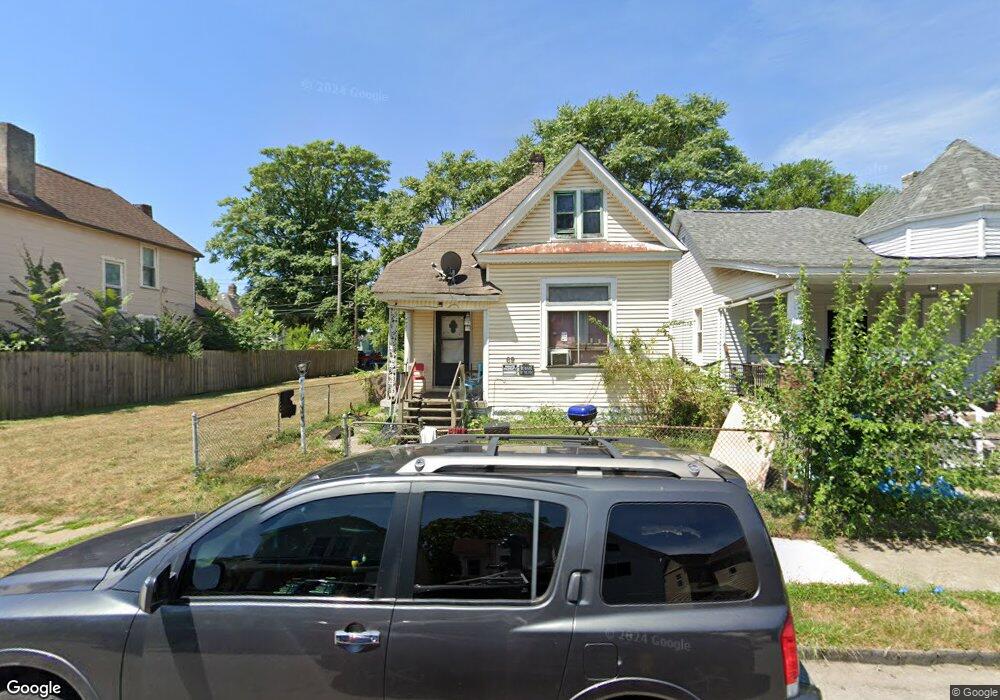
69 N Yale Ave Columbus, OH 43222
Franklinton NeighborhoodEstimated Value: $142,600 - $270,000
3
Beds
1
Bath
1,220
Sq Ft
$150/Sq Ft
Est. Value
About This Home
This home is located at 69 N Yale Ave, Columbus, OH 43222 and is currently estimated at $183,150, approximately $150 per square foot. 69 N Yale Ave is a home located in Franklin County with nearby schools including Avondale Elementary School, Starling PK-8, and West High School.
Ownership History
Date
Name
Owned For
Owner Type
Purchase Details
Closed on
Oct 16, 2017
Sold by
Mccuthen Kimberly H and Mccuthen Kimberly A
Bought by
Ford Tierra
Current Estimated Value
Home Financials for this Owner
Home Financials are based on the most recent Mortgage that was taken out on this home.
Original Mortgage
$7,000
Outstanding Balance
$5,849
Interest Rate
3.83%
Mortgage Type
Purchase Money Mortgage
Estimated Equity
$177,301
Purchase Details
Closed on
Nov 20, 2003
Sold by
U S Bank Trust Na
Bought by
Mccutchen Kimberly A and Mccutchen Kimberly H
Purchase Details
Closed on
Jun 24, 2003
Sold by
Hobson Connie E and Case #03Cve01 377
Bought by
U S Bank Trust Na and Century Home Equity Loan Trust 1997-Nc5
Purchase Details
Closed on
Jul 28, 1997
Sold by
Hobson Wendy Decarlos
Bought by
Hobson Connie E
Home Financials for this Owner
Home Financials are based on the most recent Mortgage that was taken out on this home.
Original Mortgage
$30,550
Interest Rate
7.71%
Purchase Details
Closed on
Feb 1, 1985
Create a Home Valuation Report for This Property
The Home Valuation Report is an in-depth analysis detailing your home's value as well as a comparison with similar homes in the area
Home Values in the Area
Average Home Value in this Area
Purchase History
| Date | Buyer | Sale Price | Title Company |
|---|---|---|---|
| Ford Tierra | $7,000 | Valmer Land Title Agency | |
| Mccutchen Kimberly A | $12,700 | Amerititle Agency Inc | |
| U S Bank Trust Na | $18,600 | -- | |
| Hobson Connie E | $20,000 | Capital Title | |
| -- | -- | -- |
Source: Public Records
Mortgage History
| Date | Status | Borrower | Loan Amount |
|---|---|---|---|
| Open | Ford Tierra | $7,000 | |
| Previous Owner | Hobson Connie E | $30,550 |
Source: Public Records
Tax History Compared to Growth
Tax History
| Year | Tax Paid | Tax Assessment Tax Assessment Total Assessment is a certain percentage of the fair market value that is determined by local assessors to be the total taxable value of land and additions on the property. | Land | Improvement |
|---|---|---|---|---|
| 2024 | $2,923 | $35,560 | $5,320 | $30,240 |
| 2023 | $3,066 | $35,560 | $5,320 | $30,240 |
| 2022 | $1,993 | $9,730 | $1,050 | $8,680 |
| 2021 | $1,550 | $9,730 | $1,050 | $8,680 |
| 2020 | $1,514 | $9,730 | $1,050 | $8,680 |
| 2019 | $958 | $8,130 | $880 | $7,250 |
| 2018 | $358 | $2,910 | $880 | $2,030 |
| 2017 | $628 | $8,270 | $880 | $7,390 |
| 2016 | $622 | $6,300 | $1,260 | $5,040 |
| 2015 | $541 | $6,300 | $1,260 | $5,040 |
| 2014 | $391 | $6,300 | $1,260 | $5,040 |
| 2013 | $288 | $7,000 | $1,400 | $5,600 |
Source: Public Records
Map
Nearby Homes
- 69-69.5 Chicago Ave
- 37-39 S Yale Ave
- 49 S Yale Ave
- 33 S Princeton Ave
- 79-81 Dana Ave
- 73 Rodgers Ave
- 69 Rodgers Ave
- 1020-1026 Cable Ave
- 116 W Park Ave
- 82 N Princeton Ave
- 63 Hayden Ave
- 73 Hayden Ave
- 87 S Princeton Ave
- 121-123 Hayden Ave
- 61 Dakota Ave
- 54-56 Brehl Ave
- 112 S Cypress Ave
- 148 W Park Ave
- 55 Brehl Ave
- 95-97 N Central Ave
- 73 N Yale Ave
- 65 N Yale Ave
- 77 N Yale Ave
- 53 N Yale Ave
- 85 N Yale Ave Unit 87
- 85-87 N Yale Ave
- 70 N Yale Ave
- 70 Wisconsin Ave
- 74 Wisconsin Ave Unit 76
- 64 Wisconsin Ave
- 70 N Yale Ave Unit 70
- 70 70 1 2 N Yale Ave
- 66 N Yale Ave
- 60 Wisconsin Ave
- 78 Wisconsin Ave
- 89 N Yale Ave
- 89 N Yale Ave
- 86 N Yale Ave Unit 88
- 86-88 N Yale Ave
- 76 N Yale Ave