69 New St Rehoboth, MA 02769
Estimated Value: $531,000 - $734,000
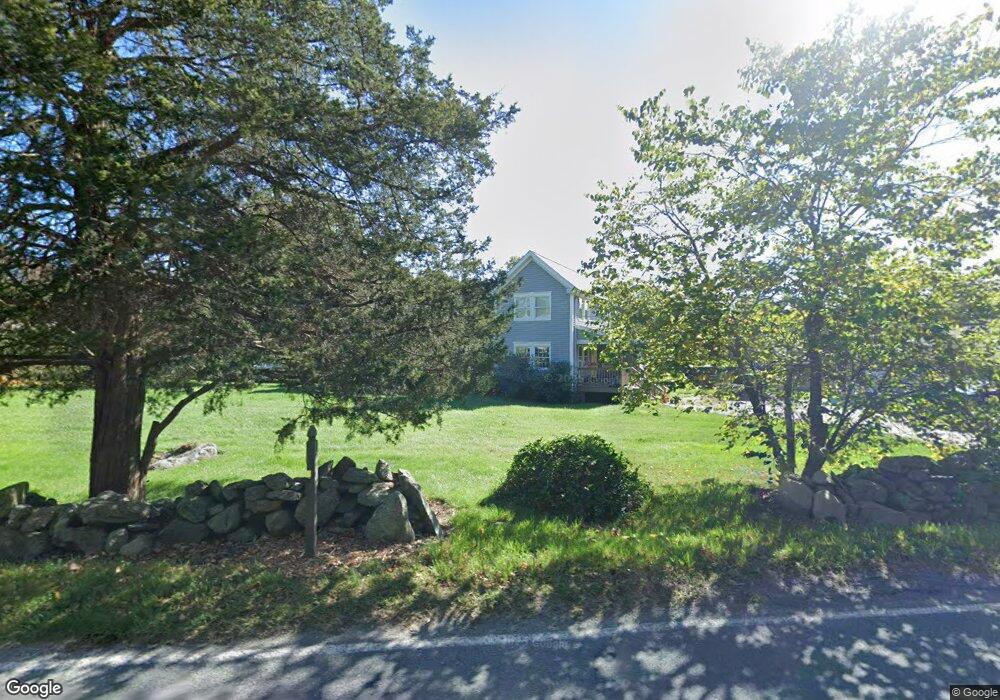
About This Home
This home is located at 69 New St, Rehoboth, MA 02769 and is currently estimated at $607,635, approximately $496 per square foot. 69 New St is a home located in Bristol County with nearby schools including Dighton-Rehoboth Regional High School and Cedar Brook School.
Ownership History
We collect this data history from publicly available records. To have your information removed, we recommend requesting removal directly through your county’s website.
Purchase Details
Purchase Details
Home Financials for this Owner
Home Financials are based on the most recent Mortgage that was taken out on this home.Home Values in the Area
Average Home Value in this Area
Purchase History
We collect this data history from publicly available records. To have your information removed, we recommend requesting removal directly through your county’s website.
| Date | Buyer | Sale Price | Title Company |
|---|---|---|---|
| -- | None Available | ||
| -- | None Available | ||
| $238,500 | -- | ||
| $238,500 | -- |
Mortgage History
We collect this data history from publicly available records. To have your information removed, we recommend requesting removal directly through your county’s website.
| Date | Status | Borrower | Loan Amount |
|---|---|---|---|
| Previous Owner | $190,000 | ||
| Previous Owner | $20,000 |
Tax History
We collect this data history from publicly available records. To have your information removed, we recommend requesting removal directly through your county’s website.
| Year | Tax Paid | Tax Assessment Tax Assessment Total Assessment is a certain percentage of the fair market value that is determined by local assessors to be the total taxable value of land and additions on the property. | Land | Improvement |
|---|---|---|---|---|
| 2025 | $6,133 | $550,000 | $196,100 | $353,900 |
| 2024 | $5,756 | $506,700 | $196,100 | $310,600 |
| 2023 | $5,803 | $501,100 | $192,100 | $309,000 |
| 2022 | $5,399 | $426,100 | $183,700 | $242,400 |
| 2021 | $5,459 | $412,300 | $167,400 | $244,900 |
| 2020 | $5,342 | $407,200 | $167,400 | $239,800 |
| 2018 | $3,582 | $351,300 | $159,600 | $191,700 |
| 2017 | $4,112 | $327,400 | $159,600 | $167,800 |
| 2016 | $3,892 | $320,300 | $159,600 | $160,700 |
| 2015 | $4,091 | $332,300 | $152,400 | $179,900 |
| 2014 | $3,896 | $313,200 | $145,200 | $168,000 |
Map
- 2233 Maple Swamp Rd
- 2471 Chestnut St
- 2103 Wheeler St
- 2103 Wheeler St
- 24 Laneway St
- 5 Glebe St
- 246 Winthrop St
- 16 Bliss St
- 593 Williams St
- 1421 Tremont St
- 1835 Oak Grove Dr
- 0 Kimberly Rd
- 260 Glebe St
- 1805 Oak Grove Dr
- 52 Round Farm Rd
- 9 Round Farm Rd
- 1 Round Farm Rd
- 145 Winthrop St
- 2043 Wellington St
- 195 Alanita Dr
Ask me questions while you tour the home.