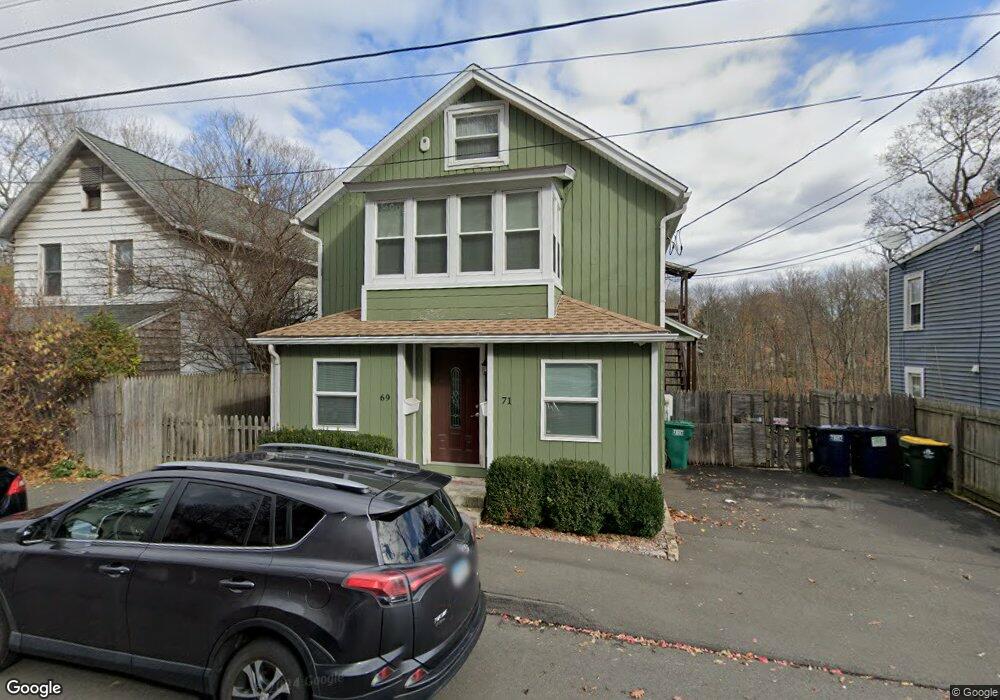
69 New St Seymour, CT 06483
Estimated Value: $294,000 - $384,000
3
Beds
2
Baths
1,432
Sq Ft
$234/Sq Ft
Est. Value
About This Home
This home is located at 69 New St, Seymour, CT 06483 and is currently estimated at $334,469, approximately $233 per square foot. 69 New St is a home located in New Haven County with nearby schools including Bungay Elementary School, Seymour Middle School, and Seymour High School.
Ownership History
Date
Name
Owned For
Owner Type
Purchase Details
Closed on
Jan 26, 2001
Sold by
Ginnow Steven J
Bought by
Pariak Jan
Current Estimated Value
Home Financials for this Owner
Home Financials are based on the most recent Mortgage that was taken out on this home.
Original Mortgage
$82,200
Outstanding Balance
$30,380
Interest Rate
7.39%
Estimated Equity
$304,089
Purchase Details
Closed on
Nov 5, 1997
Sold by
Falbo Weslie A
Bought by
Ginnow Steven J
Home Financials for this Owner
Home Financials are based on the most recent Mortgage that was taken out on this home.
Original Mortgage
$68,000
Interest Rate
7.19%
Mortgage Type
Unknown
Create a Home Valuation Report for This Property
The Home Valuation Report is an in-depth analysis detailing your home's value as well as a comparison with similar homes in the area
Home Values in the Area
Average Home Value in this Area
Purchase History
| Date | Buyer | Sale Price | Title Company |
|---|---|---|---|
| Pariak Jan | $83,500 | -- | |
| Ginnow Steven J | $72,000 | -- |
Source: Public Records
Mortgage History
| Date | Status | Borrower | Loan Amount |
|---|---|---|---|
| Open | Ginnow Steven J | $82,200 | |
| Previous Owner | Ginnow Steven J | $68,000 |
Source: Public Records
Tax History Compared to Growth
Tax History
| Year | Tax Paid | Tax Assessment Tax Assessment Total Assessment is a certain percentage of the fair market value that is determined by local assessors to be the total taxable value of land and additions on the property. | Land | Improvement |
|---|---|---|---|---|
| 2025 | $4,702 | $169,610 | $26,950 | $142,660 |
| 2024 | $4,526 | $122,850 | $20,090 | $102,760 |
| 2023 | $4,420 | $122,850 | $20,090 | $102,760 |
| 2022 | $4,372 | $122,850 | $20,090 | $102,760 |
| 2021 | $4,264 | $122,850 | $20,090 | $102,760 |
| 2020 | $3,664 | $101,780 | $23,660 | $78,120 |
| 2019 | $3,208 | $89,110 | $23,660 | $65,450 |
| 2018 | $3,208 | $89,110 | $23,660 | $65,450 |
| 2017 | $3,208 | $89,110 | $23,660 | $65,450 |
| 2016 | $3,208 | $89,110 | $23,660 | $65,450 |
| 2015 | $3,421 | $98,910 | $28,980 | $69,930 |
| 2014 | $3,367 | $98,910 | $28,980 | $69,930 |
Source: Public Records
Map
Nearby Homes
- 202 W Church St
- 235 W Church St
- 29 George St
- 61 Pershing Ave
- 26-28 S Main St
- 28 Brook St
- 77 S Main St
- 11 Oxford Rd
- 36 Bungay Terrace
- 4 Brook St
- 17 Grand St
- 20 Cherry St
- 92 Balance Rock Rd Unit 9
- 139 Derby Ave
- 38 Sanford St
- 37-14, 49-1, 79-2, 7 Balance Rock Rd
- 50 Bissell Place
- 26 Balance Rock Rd Unit 16
- 27 Wood St
- 9 Wooster St