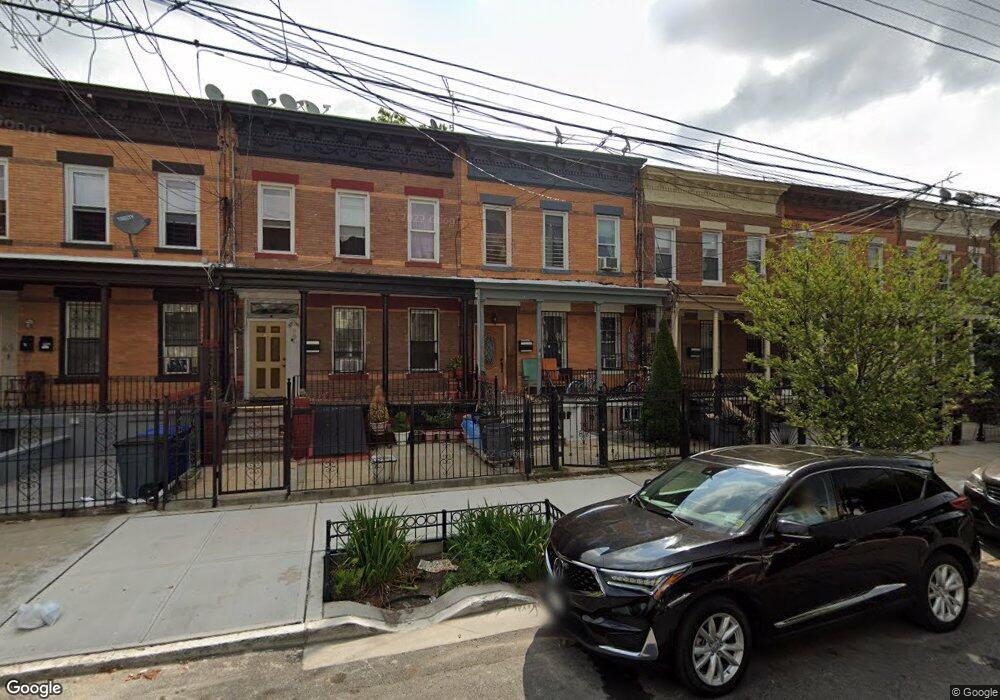
69 Nichols Ave Brooklyn, NY 11208
Cypress Hills NeighborhoodEstimated Value: $792,473 - $1,065,000
--
Bed
--
Bath
2,080
Sq Ft
$463/Sq Ft
Est. Value
About This Home
This home is located at 69 Nichols Ave, Brooklyn, NY 11208 and is currently estimated at $962,118, approximately $462 per square foot. 69 Nichols Ave is a home located in Kings County with nearby schools including P.S. 7 - Abraham Lincoln, Westridge Elementary School, and Is 171 Abraham Lincoln.
Ownership History
Date
Name
Owned For
Owner Type
Purchase Details
Closed on
Nov 2, 2018
Sold by
Tavarez Mary P
Bought by
69 Nichols Street Corp
Current Estimated Value
Purchase Details
Closed on
Sep 1, 2000
Sold by
Monegro Robert and Diaz Ramon
Bought by
Tavarez Mary P
Home Financials for this Owner
Home Financials are based on the most recent Mortgage that was taken out on this home.
Original Mortgage
$223,160
Interest Rate
7%
Mortgage Type
FHA
Create a Home Valuation Report for This Property
The Home Valuation Report is an in-depth analysis detailing your home's value as well as a comparison with similar homes in the area
Home Values in the Area
Average Home Value in this Area
Purchase History
| Date | Buyer | Sale Price | Title Company |
|---|---|---|---|
| 69 Nichols Street Corp | -- | -- | |
| Tavarez Mary P | $225,000 | -- |
Source: Public Records
Mortgage History
| Date | Status | Borrower | Loan Amount |
|---|---|---|---|
| Previous Owner | Tavarez Mary P | $223,160 |
Source: Public Records
Tax History Compared to Growth
Tax History
| Year | Tax Paid | Tax Assessment Tax Assessment Total Assessment is a certain percentage of the fair market value that is determined by local assessors to be the total taxable value of land and additions on the property. | Land | Improvement |
|---|---|---|---|---|
| 2025 | $6,997 | $53,580 | $15,600 | $37,980 |
| 2024 | $6,997 | $52,560 | $15,600 | $36,960 |
| 2023 | $6,873 | $57,300 | $15,600 | $41,700 |
| 2022 | $6,401 | $46,800 | $15,600 | $31,200 |
| 2021 | $6,372 | $44,220 | $15,600 | $28,620 |
| 2020 | $6,372 | $44,760 | $15,600 | $29,160 |
| 2019 | $6,073 | $44,760 | $15,600 | $29,160 |
| 2018 | $5,749 | $28,200 | $9,609 | $18,591 |
| 2017 | $5,447 | $26,722 | $11,756 | $14,966 |
| 2016 | $5,044 | $25,230 | $11,569 | $13,661 |
| 2015 | $3,041 | $25,230 | $12,814 | $12,416 |
| 2014 | $3,041 | $24,192 | $14,239 | $9,953 |
Source: Public Records
Map
Nearby Homes