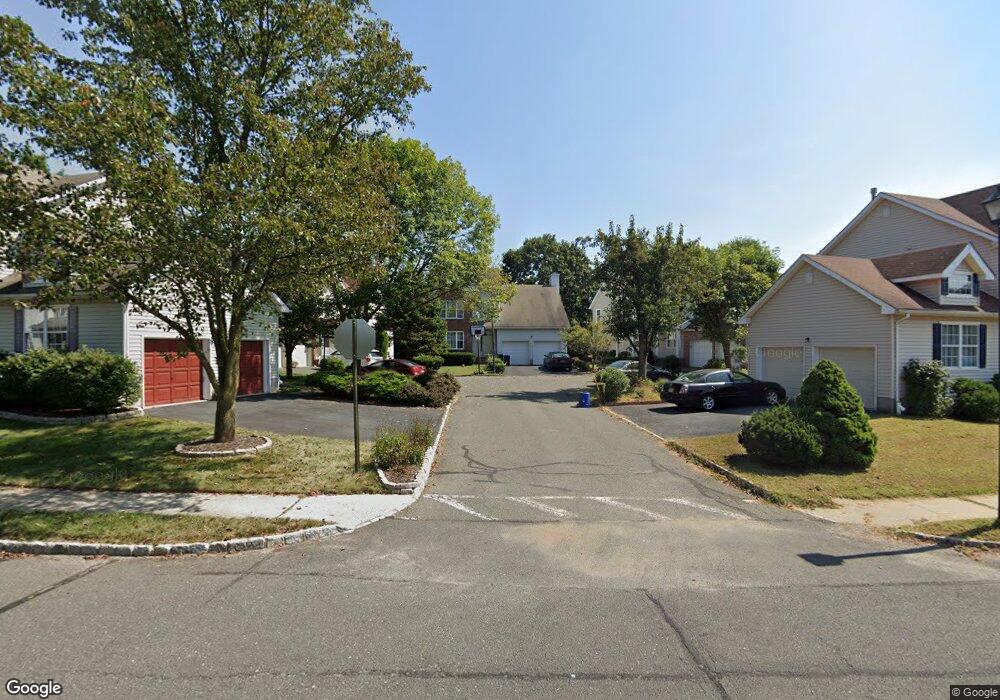
69 Nostrand Rd Hillsborough, NJ 08844
Estimated Value: $623,471 - $771,000
3
Beds
3
Baths
1,964
Sq Ft
$371/Sq Ft
Est. Value
About This Home
This home is located at 69 Nostrand Rd, Hillsborough, NJ 08844 and is currently estimated at $727,868, approximately $370 per square foot. 69 Nostrand Rd is a home located in Somerset County with nearby schools including Hillsborough High School and St Ann Classical Academy.
Ownership History
Date
Name
Owned For
Owner Type
Purchase Details
Closed on
Jun 20, 1996
Sold by
Deve Courtland
Bought by
Xie Yuxin and Wang Ming
Current Estimated Value
Home Financials for this Owner
Home Financials are based on the most recent Mortgage that was taken out on this home.
Original Mortgage
$150,000
Outstanding Balance
$9,627
Interest Rate
8.05%
Estimated Equity
$718,241
Create a Home Valuation Report for This Property
The Home Valuation Report is an in-depth analysis detailing your home's value as well as a comparison with similar homes in the area
Home Values in the Area
Average Home Value in this Area
Purchase History
| Date | Buyer | Sale Price | Title Company |
|---|---|---|---|
| Xie Yuxin | $190,000 | -- |
Source: Public Records
Mortgage History
| Date | Status | Borrower | Loan Amount |
|---|---|---|---|
| Open | Xie Yuxin | $150,000 |
Source: Public Records
Tax History Compared to Growth
Tax History
| Year | Tax Paid | Tax Assessment Tax Assessment Total Assessment is a certain percentage of the fair market value that is determined by local assessors to be the total taxable value of land and additions on the property. | Land | Improvement |
|---|---|---|---|---|
| 2025 | $12,605 | $648,400 | $332,800 | $315,600 |
| 2024 | $12,605 | $588,200 | $332,800 | $255,400 |
| 2023 | $11,686 | $542,800 | $327,800 | $215,000 |
| 2022 | $11,498 | $514,900 | $302,800 | $212,100 |
| 2021 | $9,916 | $422,300 | $237,800 | $184,500 |
| 2020 | $9,581 | $401,900 | $222,800 | $179,100 |
| 2019 | $9,325 | $387,900 | $207,800 | $180,100 |
| 2018 | $9,311 | $384,900 | $202,800 | $182,100 |
| 2017 | $8,783 | $363,700 | $152,800 | $210,900 |
| 2016 | $8,809 | $364,900 | $152,800 | $212,100 |
| 2015 | $8,618 | $361,500 | $147,800 | $213,700 |
| 2014 | $7,691 | $329,500 | $147,800 | $181,700 |
Source: Public Records
Map
Nearby Homes