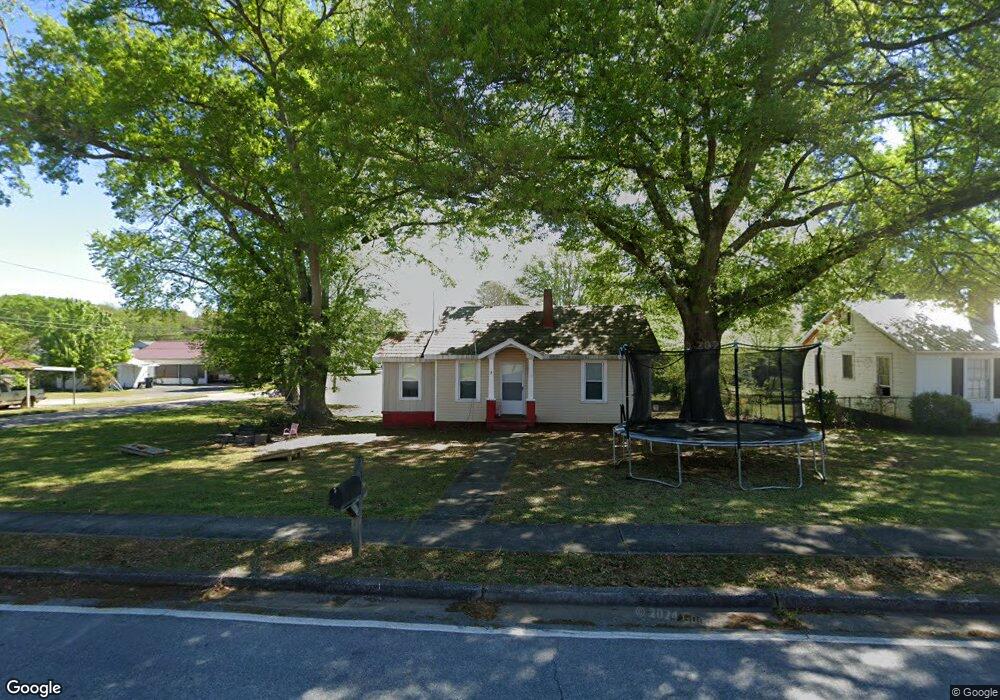
69 Oak St Aragon, GA 30104
Estimated Value: $34,091 - $184,000
2
Beds
1
Bath
978
Sq Ft
$134/Sq Ft
Est. Value
About This Home
This home is located at 69 Oak St, Aragon, GA 30104 and is currently estimated at $130,773, approximately $133 per square foot. 69 Oak St is a home located in Polk County with nearby schools including Rockmart Middle School.
Ownership History
Date
Name
Owned For
Owner Type
Purchase Details
Closed on
Nov 30, 2021
Sold by
Long Neva W
Bought by
Long Neva W and Long Jason
Current Estimated Value
Purchase Details
Closed on
Oct 3, 2016
Sold by
Jill
Bought by
Long Neva W
Purchase Details
Closed on
Sep 28, 2016
Sold by
Cecil L
Bought by
Long Neva W
Purchase Details
Closed on
Dec 3, 2007
Sold by
Wolfe Cecil L
Bought by
Wolfe Cecil L
Purchase Details
Closed on
Nov 16, 2007
Sold by
Not Provided
Bought by
Wolfe Cecil L
Purchase Details
Closed on
Feb 2, 2007
Sold by
Bobby Joe Gore
Bought by
Wolfe Glenda G
Purchase Details
Closed on
Feb 3, 1969
Sold by
Wolfe Cecil L
Bought by
Gore Bobby Joe
Purchase Details
Closed on
Aug 27, 1964
Sold by
Lindsey Paul L
Bought by
Wolfe Cecil L
Purchase Details
Closed on
Jan 9, 1960
Bought by
Lindsey Paul L
Create a Home Valuation Report for This Property
The Home Valuation Report is an in-depth analysis detailing your home's value as well as a comparison with similar homes in the area
Purchase History
| Date | Buyer | Sale Price | Title Company |
|---|---|---|---|
| Long Neva W | -- | -- | |
| Long Neva W | $13,500 | -- | |
| Long Neva W | $13,500 | -- | |
| Long Neva W | -- | -- | |
| Wolfe Cecil L | -- | -- | |
| Wolfe Cecil L | -- | -- | |
| Wolfe Glenda G | -- | -- | |
| Gore Bobby Joe | -- | -- | |
| Wolfe Cecil L | -- | -- | |
| Lindsey Paul L | -- | -- |
Source: Public Records
Tax History
| Year | Tax Paid | Tax Assessment Tax Assessment Total Assessment is a certain percentage of the fair market value that is determined by local assessors to be the total taxable value of land and additions on the property. | Land | Improvement |
|---|---|---|---|---|
| 2025 | $1,213 | $41,846 | $8,000 | $33,846 |
| 2024 | $1,100 | $38,364 | $8,000 | $30,364 |
| 2023 | $590 | $18,059 | $960 | $17,099 |
| 2022 | $379 | $15,962 | $960 | $15,002 |
| 2021 | $384 | $15,962 | $960 | $15,002 |
| 2020 | $385 | $15,962 | $960 | $15,002 |
| 2019 | $378 | $14,063 | $1,975 | $12,088 |
| 2018 | $377 | $13,668 | $1,975 | $11,693 |
| 2017 | $372 | $13,668 | $1,975 | $11,693 |
| 2016 | $372 | $13,668 | $1,975 | $11,693 |
| 2015 | $265 | $9,716 | $1,975 | $7,741 |
| 2014 | $292 | $10,615 | $2,874 | $7,741 |
Source: Public Records
Map
Nearby Homes
- 28 Walnut St
- 58 Elm St
- 30 Oak St
- 34 Elm St
- 0 Rome Hwy 101 Unit 25352772
- 0 Rome Hwy 101 Unit 10445422
- 15 Aragon Rd
- 54 Taylorsville Rd
- 11 Magnolia St
- 2300 Frettiesburg Dr
- 65 Long Station Rd
- 94 Eastwood Path
- 1638 Prospect Rd
- 70 N Bellview Rd
- 88 N Bellview Rd
- 156 Dogwood Glen Dr
- 95 Cashtown Rd
- Godd Rd
- 62 Morgan Rd
- 1019 Goss Rd
Your Personal Tour Guide
Ask me questions while you tour the home.