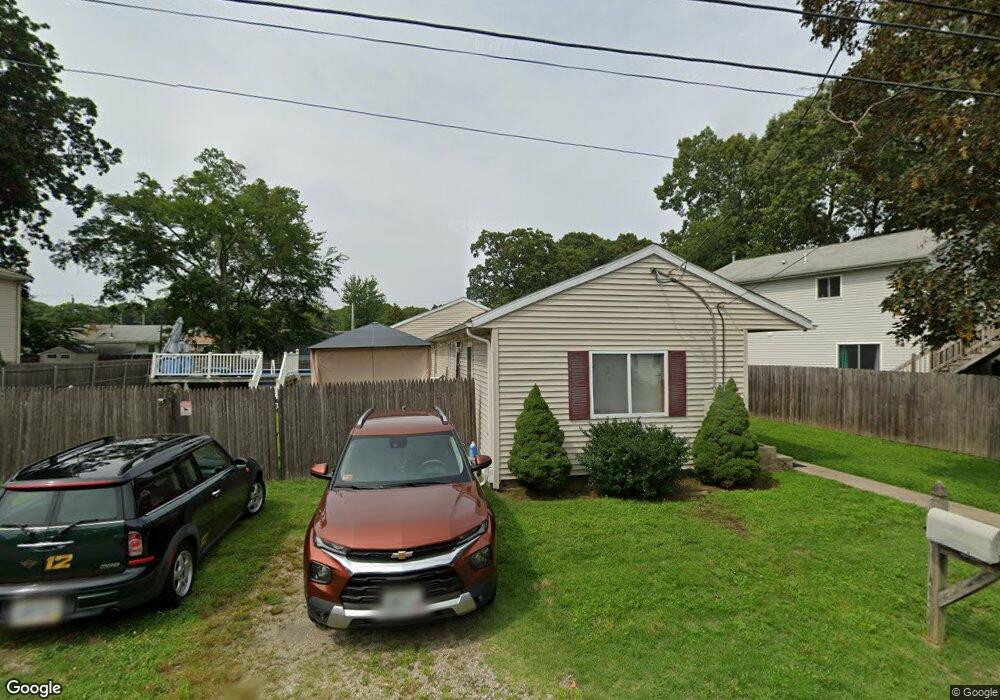
69 Oakhurst Ave Warwick, RI 02889
Oakland Beach NeighborhoodEstimated Value: $358,000 - $432,000
3
Beds
2
Baths
1,372
Sq Ft
$280/Sq Ft
Est. Value
About This Home
This home is located at 69 Oakhurst Ave, Warwick, RI 02889 and is currently estimated at $384,346, approximately $280 per square foot. 69 Oakhurst Ave is a home located in Kent County with nearby schools including Saint Kevin School and Bishop Hendricken High School.
Ownership History
Date
Name
Owned For
Owner Type
Purchase Details
Closed on
Mar 1, 2007
Sold by
Sirois Jason J and Sirois Donna L
Bought by
Marquis Susan P
Current Estimated Value
Home Financials for this Owner
Home Financials are based on the most recent Mortgage that was taken out on this home.
Original Mortgage
$174,500
Outstanding Balance
$104,628
Interest Rate
6.27%
Mortgage Type
Purchase Money Mortgage
Estimated Equity
$279,718
Purchase Details
Closed on
Aug 30, 2002
Sold by
Cascella Richard H and Cascella Donna M
Bought by
Morris Donna L
Home Financials for this Owner
Home Financials are based on the most recent Mortgage that was taken out on this home.
Original Mortgage
$97,850
Interest Rate
6.55%
Mortgage Type
Purchase Money Mortgage
Purchase Details
Closed on
Oct 22, 1998
Sold by
Misiewicz Zygmunt J and Misiewicz Shirley R
Bought by
Cascella Richard H and Cascella Donna M
Create a Home Valuation Report for This Property
The Home Valuation Report is an in-depth analysis detailing your home's value as well as a comparison with similar homes in the area
Home Values in the Area
Average Home Value in this Area
Purchase History
| Date | Buyer | Sale Price | Title Company |
|---|---|---|---|
| Marquis Susan P | $202,500 | -- | |
| Morris Donna L | $103,000 | -- | |
| Cascella Richard H | $65,000 | -- |
Source: Public Records
Mortgage History
| Date | Status | Borrower | Loan Amount |
|---|---|---|---|
| Open | Cascella Richard H | $174,500 | |
| Previous Owner | Cascella Richard H | $163,800 | |
| Previous Owner | Cascella Richard H | $97,850 | |
| Previous Owner | Cascella Richard H | $62,000 |
Source: Public Records
Tax History
| Year | Tax Paid | Tax Assessment Tax Assessment Total Assessment is a certain percentage of the fair market value that is determined by local assessors to be the total taxable value of land and additions on the property. | Land | Improvement |
|---|---|---|---|---|
| 2025 | $3,898 | $306,900 | $100,300 | $206,600 |
| 2024 | $3,629 | $250,800 | $87,200 | $163,600 |
| 2023 | $3,559 | $250,800 | $87,200 | $163,600 |
| 2022 | $3,263 | $174,200 | $51,400 | $122,800 |
| 2021 | $3,263 | $174,200 | $51,400 | $122,800 |
| 2020 | $3,263 | $174,200 | $51,400 | $122,800 |
| 2019 | $3,263 | $174,200 | $51,400 | $122,800 |
| 2018 | $2,773 | $133,300 | $51,400 | $81,900 |
| 2017 | $2,698 | $133,300 | $51,400 | $81,900 |
| 2016 | $2,698 | $133,300 | $51,400 | $81,900 |
| 2015 | $2,855 | $137,600 | $56,900 | $80,700 |
| 2014 | $2,760 | $137,600 | $56,900 | $80,700 |
| 2013 | $2,723 | $137,600 | $56,900 | $80,700 |
Source: Public Records
Map
Nearby Homes
- 73 Pinehurst Ave
- 71 Pinehurst Ave
- 79 Pinehurst Ave
- 81 Pinehurst Ave
- 75 Northup St
- 31 Oakhurst Ave
- 188 Wood St
- 107 Coburn St
- 0 Sea View Dr
- 176 Canfield Ave
- 165 Canfield Ave
- 83 Ottawa Ave
- 357 Pequot Ave
- 52 Uncas St
- 195 Oakland Beach Ave
- 9 Kenneth Ave
- 201 Hollis Ave
- 90 Huron St
- 79 Suburban Pkwy
- 72 Hollis Ave
- 77 Oakhurst Ave
- 85 Oakhurst Ave
- 6 Langley St
- 68 Oakhurst Ave
- 89 Oakhurst Ave
- 64 Oakhurst Ave
- 14 Langley St
- 179 Horse Neck Rd
- 0 Oakhurst Ave
- 0 Manning St
- 86 Oakhurst Ave
- 58 Oakhurst Ave
- 196 Horse Neck Rd
- 22 Langley St
- 200 Horse Neck Rd
- 75 Pinehurst Ave
- 26 Langley St
- 73 Salix St
- 97 Oakhurst Ave
- 3 Langley St
Your Personal Tour Guide
Ask me questions while you tour the home.