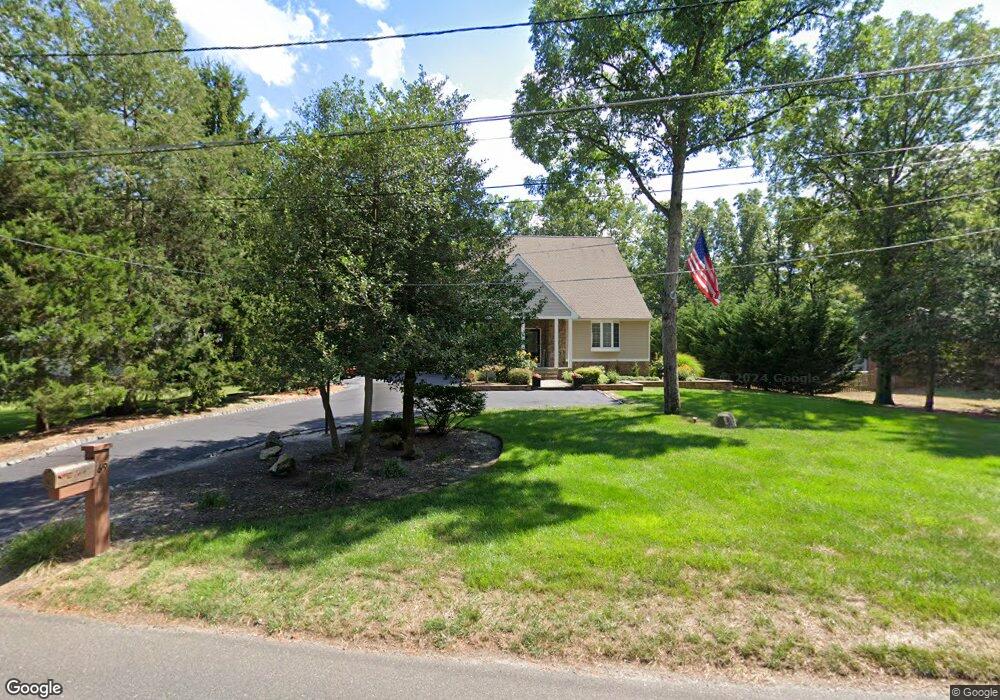
69 Oakwood Dr Medford, NJ 08055
Estimated Value: $754,000 - $818,000
--
Bed
--
Bath
2,795
Sq Ft
$282/Sq Ft
Est. Value
About This Home
This home is located at 69 Oakwood Dr, Medford, NJ 08055 and is currently estimated at $789,135, approximately $282 per square foot. 69 Oakwood Dr is a home located in Burlington County with nearby schools including Haines Memorial 6th Grade Center, Medford Township Memorial School, and Cherokee High School.
Ownership History
Date
Name
Owned For
Owner Type
Purchase Details
Closed on
Sep 23, 2019
Sold by
Lorenz John H and Petracci Alicia M
Bought by
Lorenz John H and Lorenz Alicia M
Current Estimated Value
Home Financials for this Owner
Home Financials are based on the most recent Mortgage that was taken out on this home.
Original Mortgage
$258,000
Outstanding Balance
$171,099
Interest Rate
3.6%
Mortgage Type
New Conventional
Estimated Equity
$618,036
Purchase Details
Closed on
Nov 30, 2006
Sold by
Tarzy Barry and Tarzy Alice
Bought by
Lorenz John H and Petracci Alicia M
Home Financials for this Owner
Home Financials are based on the most recent Mortgage that was taken out on this home.
Original Mortgage
$417,000
Interest Rate
6.31%
Mortgage Type
Purchase Money Mortgage
Purchase Details
Closed on
Jun 19, 2003
Sold by
Magnussen Frans J and Magnussen Anne C
Bought by
Tarzy Barry and Tarzy Alice
Create a Home Valuation Report for This Property
The Home Valuation Report is an in-depth analysis detailing your home's value as well as a comparison with similar homes in the area
Home Values in the Area
Average Home Value in this Area
Purchase History
| Date | Buyer | Sale Price | Title Company |
|---|---|---|---|
| Lorenz John H | -- | Certainty Settlement Svcs | |
| Lorenz John H | $538,711 | Guaranteed Title Agency | |
| -- | $538,700 | -- | |
| Tarzy Barry | $45,000 | United Title & Abstract |
Source: Public Records
Mortgage History
| Date | Status | Borrower | Loan Amount |
|---|---|---|---|
| Open | Lorenz John H | $258,000 | |
| Closed | -- | $417,000 |
Source: Public Records
Tax History Compared to Growth
Tax History
| Year | Tax Paid | Tax Assessment Tax Assessment Total Assessment is a certain percentage of the fair market value that is determined by local assessors to be the total taxable value of land and additions on the property. | Land | Improvement |
|---|---|---|---|---|
| 2025 | $14,196 | $400,000 | $104,000 | $296,000 |
| 2024 | $13,272 | $400,000 | $104,000 | $296,000 |
| 2023 | $13,272 | $400,000 | $104,000 | $296,000 |
| 2022 | $13,000 | $400,000 | $104,000 | $296,000 |
| 2021 | $12,928 | $400,000 | $104,000 | $296,000 |
| 2020 | $12,848 | $400,000 | $104,000 | $296,000 |
| 2019 | $12,676 | $400,000 | $104,000 | $296,000 |
| 2018 | $12,500 | $400,000 | $104,000 | $296,000 |
| 2017 | $12,412 | $400,000 | $104,000 | $296,000 |
| 2016 | $12,368 | $400,000 | $104,000 | $296,000 |
| 2015 | $12,184 | $400,000 | $104,000 | $296,000 |
| 2014 | $11,812 | $400,000 | $104,000 | $296,000 |
Source: Public Records
Map
Nearby Homes
- 70 Oakwood Dr
- 20 Elm Dr
- 6 Friar Tuck Dr
- 4 Sherwood Dr
- 120 Bracken Rd
- 162 Tuckerton Rd
- 39 Georgia Trail
- 32 Ohio Trail
- 217 Taunton Blvd
- 1 Knotty Oak Dr
- 123 Pine Valley Dr
- 547 Fairview Rd
- 308 Tavistock Dr
- 5 Birchwood Dr
- 3 Virginia Trail
- 28 Brattleboro Ct Unit 7
- 2 Nantucket Ct
- 0 Jackson Rd Unit NJBL2085060
- 196 Sunny Jim Dr
- 2 Wellington Ct