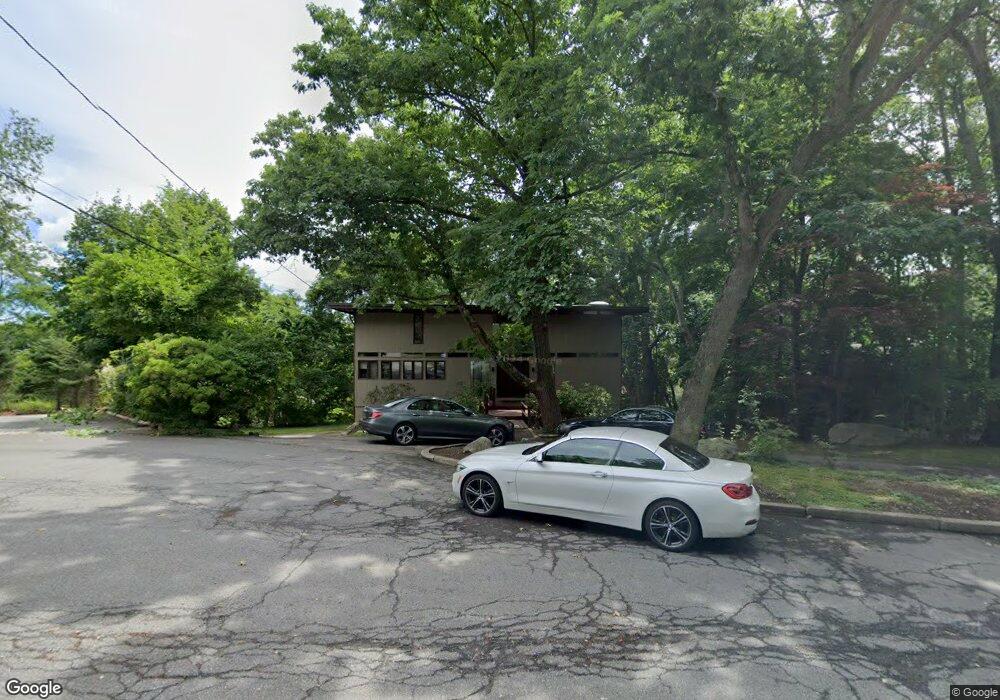
69 Ober Rd Newton Center, MA 02459
Oak Hill NeighborhoodEstimated Value: $1,938,357 - $2,206,000
5
Beds
4
Baths
2,688
Sq Ft
$780/Sq Ft
Est. Value
About This Home
This home is located at 69 Ober Rd, Newton Center, MA 02459 and is currently estimated at $2,096,839, approximately $780 per square foot. 69 Ober Rd is a home located in Middlesex County with nearby schools including Memorial Spaulding Elementary School, Oak Hill Middle School, and Newton South High School.
Ownership History
Date
Name
Owned For
Owner Type
Purchase Details
Closed on
Jun 18, 1996
Sold by
Baye Phyllis D
Bought by
Muroff Mitchell B and Muroff Marjorie
Current Estimated Value
Create a Home Valuation Report for This Property
The Home Valuation Report is an in-depth analysis detailing your home's value as well as a comparison with similar homes in the area
Home Values in the Area
Average Home Value in this Area
Purchase History
| Date | Buyer | Sale Price | Title Company |
|---|---|---|---|
| Muroff Mitchell B | $485,000 | -- |
Source: Public Records
Mortgage History
| Date | Status | Borrower | Loan Amount |
|---|---|---|---|
| Open | Muroff Mitchell B | $200,000 | |
| Closed | Muroff Mitchell B | $100,000 | |
| Closed | Muroff Mitchell B | $100,000 |
Source: Public Records
Tax History Compared to Growth
Tax History
| Year | Tax Paid | Tax Assessment Tax Assessment Total Assessment is a certain percentage of the fair market value that is determined by local assessors to be the total taxable value of land and additions on the property. | Land | Improvement |
|---|---|---|---|---|
| 2025 | $15,803 | $1,612,500 | $1,198,300 | $414,200 |
| 2024 | $15,279 | $1,565,500 | $1,163,400 | $402,100 |
| 2023 | $14,637 | $1,437,800 | $916,100 | $521,700 |
| 2022 | $14,005 | $1,331,300 | $848,200 | $483,100 |
| 2021 | $13,513 | $1,255,900 | $800,200 | $455,700 |
| 2020 | $13,112 | $1,255,900 | $800,200 | $455,700 |
| 2019 | $12,742 | $1,219,300 | $776,900 | $442,400 |
| 2018 | $12,287 | $1,135,600 | $704,500 | $431,100 |
| 2017 | $11,913 | $1,071,300 | $664,600 | $406,700 |
| 2016 | $11,394 | $1,001,200 | $621,100 | $380,100 |
| 2015 | $10,863 | $935,700 | $580,500 | $355,200 |
Source: Public Records
Map
Nearby Homes
- 44 Lovett Rd
- 21 Lovett Rd
- 36 Ober Rd
- 135 Hartman Rd
- 41 Juniper Ln
- 63 Drumlin Rd
- 853 Dedham St
- 59 Deborah Rd
- 99 Baldpate Hill Rd
- 56 Cynthia Rd
- 133 Oak Hill St
- 65 Levbert Rd
- 58 Country Club Rd
- 22 Nightingale Path
- 544 Saw Mill Brook Pkwy
- 30 Esty Farm Rd
- 70 Pond Brook Rd
- 1307 Lagrange St Unit 1307
- 109 Harwich Rd
- 207 Nahanton St Unit 207