
Landlord's Agent in 2023
Glenn McDonald
The Firm
(781) 929-4774
7 in this area
45 Total Sales


Estimated Value: $604,552 - $793,000
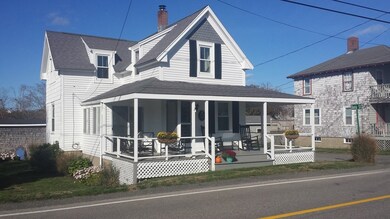
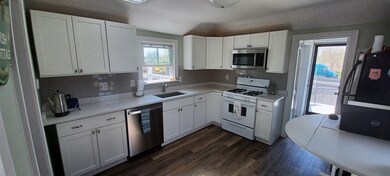
SUMMER WEEKLY RENTAL. Rate is $2,200 per week. Not available for July. What a great spot, set on 'The High Road' with views all around. Sit on this wrap around porch and watch the ships and boats on heading to Boston or P-Town.Lots of outdoor spaces. Updated kitchen, Laundry in unit, outdoor shower. Close to Beaches, Restaurants and shopping. Town Pier is just down the road. Your perfect spot for a Relaxing Summer Vacation!
| Date | Buyer | Sale Price | Title Company |
|---|---|---|---|
| Moriarty John P | $289,000 | -- | |
| 69 Ocean Street Rt | -- | -- | |
| Magliarditi Mary J | $11,805 | -- |
| Date | Status | Borrower | Loan Amount |
|---|---|---|---|
| Open | Moriarty John P | $231,000 | |
| Previous Owner | Magliarditi Mary J | $75,000 |
| Date | Event | Price | List to Sale | Price per Sq Ft | Prior Sale |
|---|---|---|---|---|---|
| 08/11/2023 08/11/23 | Rented | $2,200 | +10.0% | -- | |
| 08/11/2023 08/11/23 | Under Contract | -- | -- | -- | |
| 04/06/2023 04/06/23 | For Rent | $2,000 | 0.0% | -- | |
| 02/27/2015 02/27/15 | Sold | $289,000 | -8.2% | $250 / Sq Ft | View Prior Sale |
| 01/15/2015 01/15/15 | Pending | -- | -- | -- | |
| 01/05/2015 01/05/15 | For Sale | $314,900 | +9.0% | $272 / Sq Ft | |
| 12/15/2014 12/15/14 | Off Market | $289,000 | -- | -- | |
| 08/03/2014 08/03/14 | Price Changed | $314,900 | -6.0% | $272 / Sq Ft | |
| 07/11/2014 07/11/14 | Price Changed | $334,900 | -2.9% | $289 / Sq Ft | |
| 05/06/2014 05/06/14 | Price Changed | $344,900 | -2.8% | $298 / Sq Ft | |
| 03/07/2014 03/07/14 | For Sale | $355,000 | -- | $307 / Sq Ft |
| Year | Tax Paid | Tax Assessment Tax Assessment Total Assessment is a certain percentage of the fair market value that is determined by local assessors to be the total taxable value of land and additions on the property. | Land | Improvement |
|---|---|---|---|---|
| 2025 | $5,001 | $505,200 | $377,000 | $128,200 |
| 2024 | $4,971 | $478,400 | $357,200 | $121,200 |
| 2023 | $4,409 | $408,400 | $309,500 | $98,900 |
| 2022 | $4,409 | $340,500 | $248,000 | $92,500 |
| 2021 | $4,375 | $331,700 | $248,000 | $83,700 |
| 2020 | $4,364 | $327,400 | $248,000 | $79,400 |
| 2019 | $4,322 | $323,000 | $248,000 | $75,000 |
| 2018 | $3,788 | $283,300 | $208,300 | $75,000 |
| 2017 | $3,730 | $271,900 | $208,300 | $63,600 |
| 2016 | $3,960 | $285,300 | $208,300 | $77,000 |
| 2015 | $3,660 | $275,400 | $198,400 | $77,000 |
| 2014 | $3,721 | $280,000 | $208,300 | $71,700 |
Landlord's Agent in 2023
Glenn McDonald
The Firm
(781) 929-4774
7 in this area
45 Total Sales
Seller's Agent in 2015
Nannette Parziale
Colonial Realty Group - South Shore
(781) 834-4311
4 in this area
18 Total Sales
Source: MLS Property Information Network (MLS PIN)
MLS Number: 73095645
APN: MARS-000006N-000006-000020
Disclaimer: Certain information contained herein is derived from information provided by parties other than Homes.com. All information provided is deemed reliable, but is not guaranteed to be accurate and should be independently verified.
![]() The property listing data and information, or the Images, set forth herein were provided to MLS Property Information Network, Inc. from third party sources, including sellers, lessors and public records, and were compiled by MLS Property Information Network, Inc. The property listing data and information, and the Images, are for the personal, non-commercial use of consumers having a good faith interest in purchasing or leasing listed properties of the type displayed to them and may not be used for any purpose other than to identify prospective properties which such consumers may have a good faith interest in purchasing or leasing. MLS Property Information Network, Inc. and its subscribers disclaim any and all representations and warranties as to the accuracy of the property listing data and information, or as to the accuracy of any of the Images, set forth herein.
The property listing data and information, or the Images, set forth herein were provided to MLS Property Information Network, Inc. from third party sources, including sellers, lessors and public records, and were compiled by MLS Property Information Network, Inc. The property listing data and information, and the Images, are for the personal, non-commercial use of consumers having a good faith interest in purchasing or leasing listed properties of the type displayed to them and may not be used for any purpose other than to identify prospective properties which such consumers may have a good faith interest in purchasing or leasing. MLS Property Information Network, Inc. and its subscribers disclaim any and all representations and warranties as to the accuracy of the property listing data and information, or as to the accuracy of any of the Images, set forth herein.