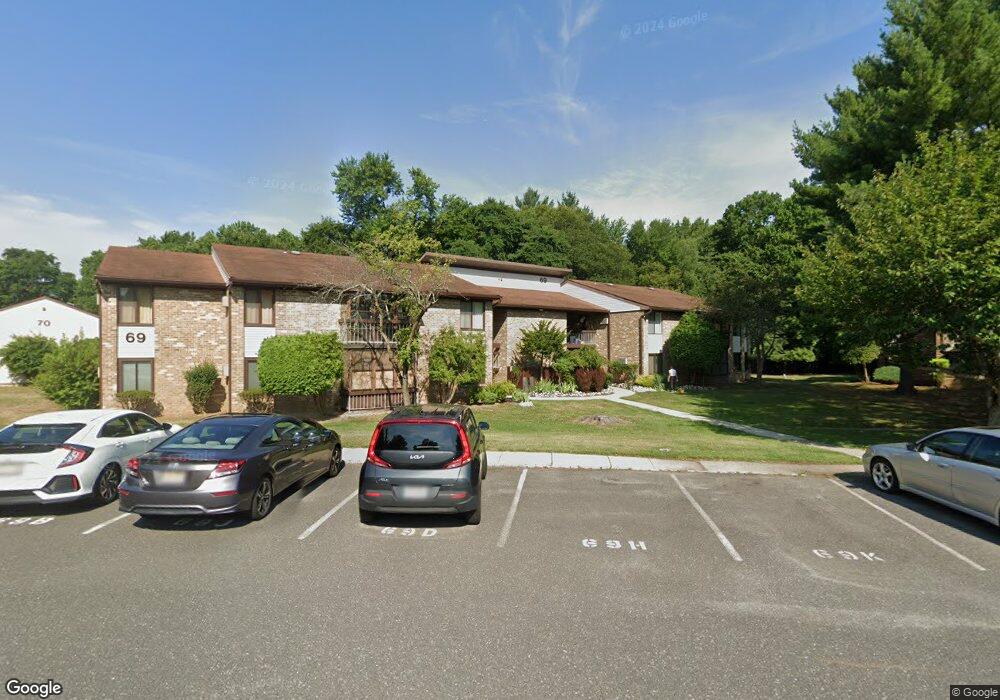
69 Overlook Way Unit B Manalapan, NJ 07726
Estimated Value: $209,000 - $232,140
2
Beds
1
Bath
920
Sq Ft
$239/Sq Ft
Est. Value
About This Home
This home is located at 69 Overlook Way Unit B, Manalapan, NJ 07726 and is currently estimated at $220,047, approximately $239 per square foot. 69 Overlook Way Unit B is a home located in Monmouth County with nearby schools including Milford Brook Elementary School, Pine Brook Elementary School, and Manalapan-Englishtown Middle School.
Ownership History
Date
Name
Owned For
Owner Type
Purchase Details
Closed on
Oct 6, 2020
Sold by
Lahetta Michele
Bought by
Maya Albert and Maya Jane
Current Estimated Value
Purchase Details
Closed on
Jul 30, 2020
Sold by
Gertler Mervin M
Bought by
Lahetta Michele
Purchase Details
Closed on
Apr 15, 2002
Sold by
Klein Sam
Bought by
Gertler Mervi
Home Financials for this Owner
Home Financials are based on the most recent Mortgage that was taken out on this home.
Original Mortgage
$40,000
Interest Rate
6.81%
Create a Home Valuation Report for This Property
The Home Valuation Report is an in-depth analysis detailing your home's value as well as a comparison with similar homes in the area
Home Values in the Area
Average Home Value in this Area
Purchase History
| Date | Buyer | Sale Price | Title Company |
|---|---|---|---|
| Maya Albert | $135,000 | All Ahead Title Agency | |
| Maya Albert | $135,000 | All Ahead Title | |
| Lahetta Michele | -- | None Available | |
| Gertler Mervi | $72,500 | -- |
Source: Public Records
Mortgage History
| Date | Status | Borrower | Loan Amount |
|---|---|---|---|
| Previous Owner | Gertler Mervi | $40,000 |
Source: Public Records
Tax History Compared to Growth
Tax History
| Year | Tax Paid | Tax Assessment Tax Assessment Total Assessment is a certain percentage of the fair market value that is determined by local assessors to be the total taxable value of land and additions on the property. | Land | Improvement |
|---|---|---|---|---|
| 2025 | $3,180 | $213,800 | $90,000 | $123,800 |
| 2024 | $2,927 | $188,400 | $80,000 | $108,400 |
| 2023 | $2,927 | $175,900 | $70,000 | $105,900 |
| 2022 | $2,672 | $159,800 | $59,000 | $100,800 |
| 2021 | $2,672 | $128,700 | $39,000 | $89,700 |
| 2020 | $2,529 | $123,200 | $34,000 | $89,200 |
| 2019 | $1,946 | $94,700 | $20,500 | $74,200 |
| 2018 | $2,141 | $103,600 | $20,500 | $83,100 |
| 2017 | $2,099 | $101,600 | $22,000 | $79,600 |
| 2016 | $1,999 | $97,900 | $19,400 | $78,500 |
| 2015 | $1,504 | $85,000 | $8,500 | $76,500 |
| 2014 | $1,393 | $77,500 | $18,000 | $59,500 |
Source: Public Records
Map
Nearby Homes
- 70 Overlook Way Unit E
- 75 Overlook Way Unit K
- 84 Amberly Dr Unit J
- 86 Arrowood Rd Unit B
- 93 Arrowood Rd Unit G
- 5 Yeoman Way
- 97 Arrowood Rd Unit A
- 54 Amberly Dr Unit G
- 544 Union Hill Rd
- 34 Sherwood Rd
- 0-0 Union Hill Rd
- 162 Cross Slope Ct Unit K
- 171 Amberly Dr Unit G
- 154 Cross Slope Ct Unit G
- 167 Amberly Dr Unit H
- 519 Union Hill Rd
- 521 Union Hill Rd
- 141 Cross Slope Ct
- 141 Cross Slope Ct Unit A
- 150 Amberly Dr Unit A
- 69 Overlook Way Unit C
- 69 Overlook Way Unit J
- 69 Overlook Way Unit H
- 69 Overlook Way Unit F
- 69 Overlook Way Unit A
- 69 Overlook Way Unit K
- 69 Overlook Way Unit D
- 69 Overlook Way Unit G
- 69 Overlook Way Unit E
- 68 Overlook Way Unit J
- 68 Overlook Way Unit B
- 68 Overlook Way Unit A
- 68 Overlook Way Unit F
- 68 Overlook Way Unit G
- 68 Overlook Way Unit H
- 68 Overlook Way Unit C
- 68 Overlook Way Unit K
- 68 Overlook Way Unit E
- 68 Overlook Way Unit D
- 68 Overlook Way