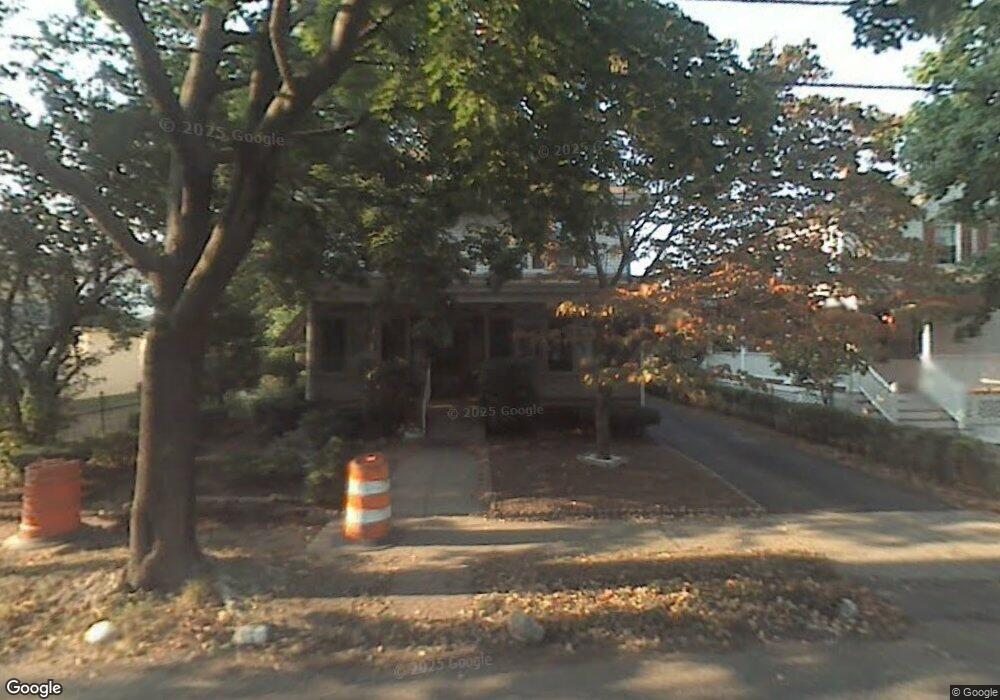
69 Phillips St Quincy, MA 02170
Wollaston NeighborhoodEstimated Value: $757,000 - $880,000
4
Beds
2
Baths
1,791
Sq Ft
$447/Sq Ft
Est. Value
About This Home
This home is located at 69 Phillips St, Quincy, MA 02170 and is currently estimated at $800,056, approximately $446 per square foot. 69 Phillips St is a home located in Norfolk County with nearby schools including Beechwood Knoll Elementary School, Central Middle School, and North Quincy High School.
Ownership History
Date
Name
Owned For
Owner Type
Purchase Details
Closed on
Feb 18, 2011
Sold by
Mormino Kathleen M and Mcmahon Paul J
Bought by
Lin Xin H and Chen Yu H
Current Estimated Value
Home Financials for this Owner
Home Financials are based on the most recent Mortgage that was taken out on this home.
Original Mortgage
$185,000
Outstanding Balance
$124,663
Interest Rate
4.77%
Mortgage Type
Purchase Money Mortgage
Estimated Equity
$675,393
Purchase Details
Closed on
Sep 28, 2004
Sold by
Mcmahon Arthur F
Bought by
Mcmahon Brian J and Morin Carol J
Create a Home Valuation Report for This Property
The Home Valuation Report is an in-depth analysis detailing your home's value as well as a comparison with similar homes in the area
Home Values in the Area
Average Home Value in this Area
Purchase History
| Date | Buyer | Sale Price | Title Company |
|---|---|---|---|
| Lin Xin H | $341,000 | -- | |
| Mcmahon Brian J | -- | -- |
Source: Public Records
Mortgage History
| Date | Status | Borrower | Loan Amount |
|---|---|---|---|
| Open | Lin Xin H | $185,000 |
Source: Public Records
Tax History
| Year | Tax Paid | Tax Assessment Tax Assessment Total Assessment is a certain percentage of the fair market value that is determined by local assessors to be the total taxable value of land and additions on the property. | Land | Improvement |
|---|---|---|---|---|
| 2025 | $7,994 | $693,300 | $331,900 | $361,400 |
| 2024 | $7,732 | $686,100 | $331,900 | $354,200 |
| 2023 | $7,188 | $645,800 | $316,100 | $329,700 |
| 2022 | $6,759 | $564,200 | $252,900 | $311,300 |
| 2021 | $6,712 | $552,900 | $252,900 | $300,000 |
| 2020 | $6,604 | $531,300 | $252,900 | $278,400 |
| 2019 | $6,299 | $501,900 | $236,300 | $265,600 |
| 2018 | $6,143 | $460,500 | $214,900 | $245,600 |
| 2017 | $6,198 | $437,400 | $214,900 | $222,500 |
| 2016 | $5,783 | $402,700 | $195,300 | $207,400 |
| 2015 | $5,263 | $360,500 | $177,600 | $182,900 |
| 2014 | $4,993 | $336,000 | $169,100 | $166,900 |
Source: Public Records
Map
Nearby Homes
- 10 W Elm Ave
- 11 Gould St
- 19 Bass St
- 20 Ellington Rd
- 10 Weston Ave Unit 322
- 163 Clay St Unit 3
- 28 Apthorp St
- 9 Chick St
- 100 Grand View Ave Unit 9C
- 267-269 Farrington St
- 27 Herbert Rd
- 107 Fayette St
- 915 Hancock St Unit 2
- 45 Oval Rd Unit 34
- 98 Safford St
- 17 Holmes St Unit 204
- 17 Holmes St Unit 2
- 17 Holmes St Unit 1
- 54 Safford St
- 154 N Central Ave
Your Personal Tour Guide
Ask me questions while you tour the home.