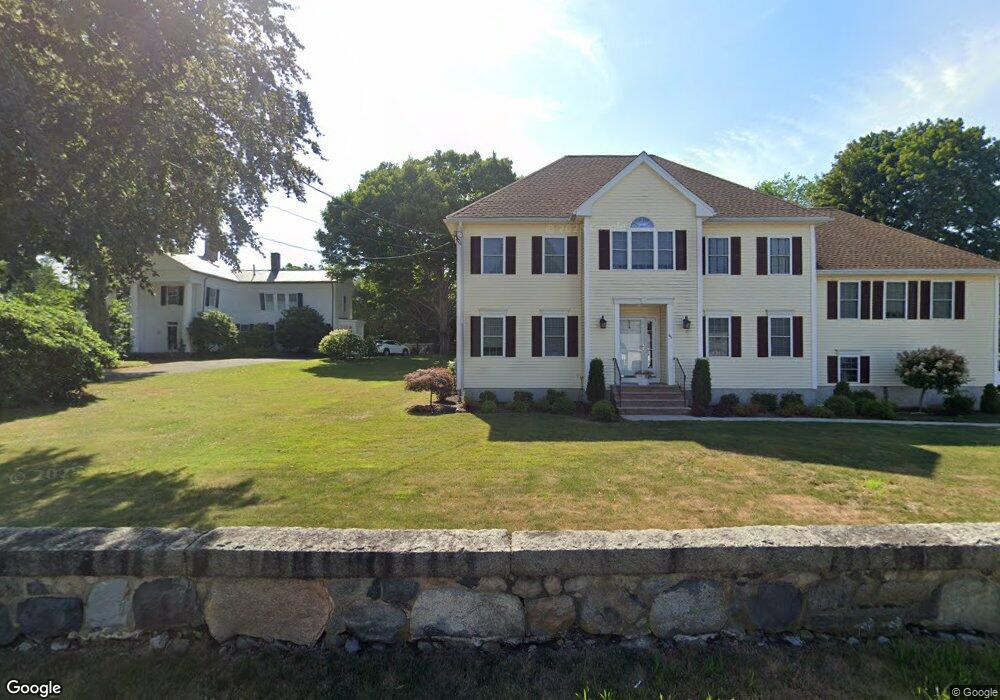
69 Pine St Danvers, MA 01923
Estimated Value: $644,000 - $981,000
2
Beds
2
Baths
1,163
Sq Ft
$680/Sq Ft
Est. Value
About This Home
This home is located at 69 Pine St, Danvers, MA 01923 and is currently estimated at $790,459, approximately $679 per square foot. 69 Pine St is a home located in Essex County with nearby schools including Danvers High School, St. Mary of the Annunciation School, and Plumfield Academy.
Ownership History
Date
Name
Owned For
Owner Type
Purchase Details
Closed on
Aug 11, 2004
Sold by
Overlook Rt
Bought by
Glass Brian
Current Estimated Value
Home Financials for this Owner
Home Financials are based on the most recent Mortgage that was taken out on this home.
Original Mortgage
$524,250
Outstanding Balance
$260,852
Interest Rate
5.84%
Estimated Equity
$529,607
Purchase Details
Closed on
Sep 10, 2002
Sold by
Anastasi Sandra C
Bought by
Overlook Rt
Create a Home Valuation Report for This Property
The Home Valuation Report is an in-depth analysis detailing your home's value as well as a comparison with similar homes in the area
Home Values in the Area
Average Home Value in this Area
Purchase History
| Date | Buyer | Sale Price | Title Company |
|---|---|---|---|
| Glass Brian | $600,000 | -- | |
| Overlook Rt | $1,200,000 | -- |
Source: Public Records
Mortgage History
| Date | Status | Borrower | Loan Amount |
|---|---|---|---|
| Open | Overlook Rt | $50,000 | |
| Open | Overlook Rt | $524,250 |
Source: Public Records
Tax History Compared to Growth
Tax History
| Year | Tax Paid | Tax Assessment Tax Assessment Total Assessment is a certain percentage of the fair market value that is determined by local assessors to be the total taxable value of land and additions on the property. | Land | Improvement |
|---|---|---|---|---|
| 2025 | $7,733 | $703,600 | $390,700 | $312,900 |
| 2024 | $7,474 | $672,700 | $390,700 | $282,000 |
| 2023 | $6,975 | $593,600 | $335,700 | $257,900 |
| 2022 | $6,776 | $535,200 | $295,200 | $240,000 |
| 2021 | $6,092 | $456,300 | $243,900 | $212,400 |
| 2020 | $6,214 | $475,800 | $243,900 | $231,900 |
| 2019 | $6,462 | $486,600 | $254,700 | $231,900 |
| 2018 | $6,032 | $445,500 | $252,000 | $193,500 |
| 2017 | $6,227 | $438,800 | $245,300 | $193,500 |
| 2016 | $5,940 | $418,300 | $234,500 | $183,800 |
| 2015 | $5,879 | $394,300 | $214,200 | $180,100 |
Source: Public Records
Map
Nearby Homes
- 6 Kimberly Dr
- 39 Roosevelt Ave
- 14 Williams St Unit C17
- 22 Collins St Unit 31
- 57 Adams St
- 4 Butler Ave
- 63 Adams St
- 35 Locust St Unit 3
- 12 Central Ave Unit 1
- 4 Briarwood Dr
- 267 Centre St
- 35 High St Unit 3D
- 11 Spring St
- 38 High St Unit 4
- 103 Newbury St Unit 3
- 103 Newbury St Unit 1
- 96 Newbury St Unit 6B
- 108 Abington Rd Unit 108
- 98 Newbury St Unit 4B
- 98 Newbury St Unit 18B