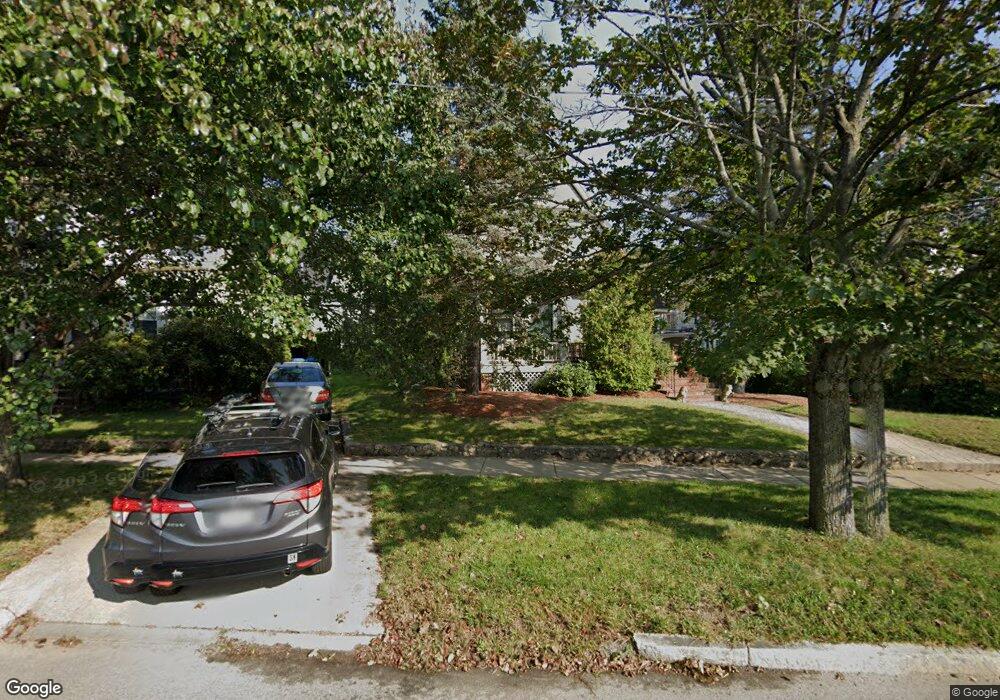
69 Playstead Rd Medford, MA 02155
West Medford NeighborhoodEstimated Value: $1,044,000 - $1,209,899
3
Beds
1
Bath
2,585
Sq Ft
$445/Sq Ft
Est. Value
About This Home
This home is located at 69 Playstead Rd, Medford, MA 02155 and is currently estimated at $1,150,225, approximately $444 per square foot. 69 Playstead Rd is a home located in Middlesex County with nearby schools including Medford High School, Saint Raphael School, and St. Joseph School.
Ownership History
Date
Name
Owned For
Owner Type
Purchase Details
Closed on
Jul 31, 1991
Sold by
Cortina Theresa S
Bought by
Seidel Michael and Seidel Kathleen
Current Estimated Value
Home Financials for this Owner
Home Financials are based on the most recent Mortgage that was taken out on this home.
Original Mortgage
$133,500
Interest Rate
9.58%
Mortgage Type
Purchase Money Mortgage
Create a Home Valuation Report for This Property
The Home Valuation Report is an in-depth analysis detailing your home's value as well as a comparison with similar homes in the area
Home Values in the Area
Average Home Value in this Area
Purchase History
| Date | Buyer | Sale Price | Title Company |
|---|---|---|---|
| Seidel Michael | $168,500 | -- |
Source: Public Records
Mortgage History
| Date | Status | Borrower | Loan Amount |
|---|---|---|---|
| Open | Seidel Michael | $200,000 | |
| Closed | Seidel Michael | $121,500 | |
| Closed | Seidel Michael | $138,000 | |
| Closed | Seidel Michael | $133,500 |
Source: Public Records
Tax History
| Year | Tax Paid | Tax Assessment Tax Assessment Total Assessment is a certain percentage of the fair market value that is determined by local assessors to be the total taxable value of land and additions on the property. | Land | Improvement |
|---|---|---|---|---|
| 2025 | $9,956 | $1,131,400 | $458,700 | $672,700 |
| 2024 | $9,308 | $1,092,500 | $436,800 | $655,700 |
| 2023 | $8,994 | $1,039,800 | $408,300 | $631,500 |
| 2022 | $8,358 | $927,600 | $371,100 | $556,500 |
| 2021 | $8,312 | $883,300 | $353,500 | $529,800 |
| 2020 | $8,198 | $893,000 | $353,500 | $539,500 |
| 2019 | $7,915 | $824,500 | $321,300 | $503,200 |
| 2018 | $7,400 | $722,700 | $292,100 | $430,600 |
| 2017 | $7,155 | $677,600 | $273,000 | $404,600 |
| 2016 | $6,893 | $616,000 | $248,200 | $367,800 |
| 2015 | $6,642 | $567,700 | $236,400 | $331,300 |
Source: Public Records
Map
Nearby Homes
- 75 Warren St
- 4 Grove St
- 40 Century St
- 421 High St Unit 203
- 14 Symmes St
- 14 Holton St Unit 4
- 22 Prescott St
- 31 Sharon St
- 44 Sherman St
- 47 Holton St
- 111 Sharon St Unit 1
- 145 Jerome St
- 0 Jerome St Unit 72734260
- 545 Winthrop St Unit Lot 6
- 545 Winthrop St Unit Lot 8
- 545 Winthrop St Unit Lot 7
- 132 Dover St
- 14 Ivy Rd
- 157 Boston Ave Unit 1
- 48 Mystic Lake Dr Unit 48
- 73 Playstead Rd
- 77 Playstead Rd
- 10 Gorham Rd
- 10 Gorham Rd Unit 1
- 10 Gorham Rd Unit 2
- 81 Playstead Rd
- 81 Playstead Rd Unit 1
- 5 Gorham Rd
- 5 Gorham Rd Unit 2
- 5 Gorham Rd
- 5 Gorham Rd Unit 1
- 67 Playstead Rd
- 14 Gorham Rd
- 7 Gorham Rd
- 7 Gorham Rd Unit 2
- 7 Gorham Rd Unit 1
- 65 Playstead Rd
- 65 Playstead Rd Unit 2
- 7 Chardon Rd
- 11 Gorham Rd
Your Personal Tour Guide
Ask me questions while you tour the home.