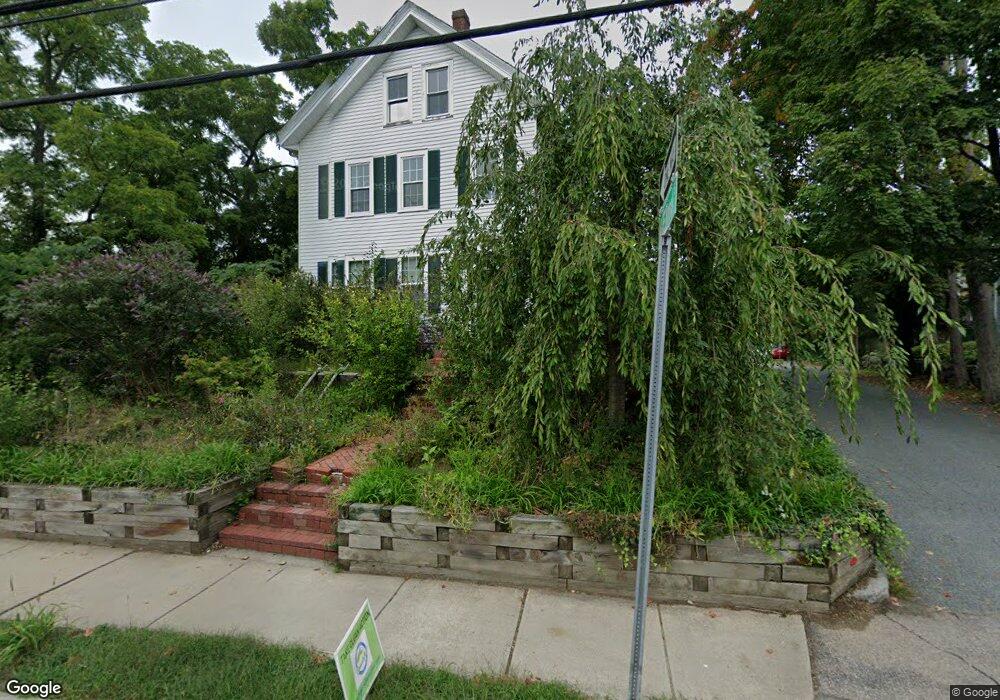
69 Pond St Unit 1 Natick, MA 01760
Estimated Value: $838,000 - $1,127,878
2
Beds
1
Bath
1,200
Sq Ft
$809/Sq Ft
Est. Value
About This Home
This home is located at 69 Pond St Unit 1, Natick, MA 01760 and is currently estimated at $970,220, approximately $808 per square foot. 69 Pond St Unit 1 is a home located in Middlesex County with nearby schools including Natick High School, Johnson Elementary School, and J F Kennedy Middle School.
Ownership History
Date
Name
Owned For
Owner Type
Purchase Details
Closed on
Jun 20, 2003
Sold by
Phillips Ft S Tr
Bought by
Buttfield Carey
Current Estimated Value
Home Financials for this Owner
Home Financials are based on the most recent Mortgage that was taken out on this home.
Original Mortgage
$410,875
Outstanding Balance
$179,068
Interest Rate
5.71%
Mortgage Type
Purchase Money Mortgage
Estimated Equity
$791,152
Create a Home Valuation Report for This Property
The Home Valuation Report is an in-depth analysis detailing your home's value as well as a comparison with similar homes in the area
Home Values in the Area
Average Home Value in this Area
Purchase History
| Date | Buyer | Sale Price | Title Company |
|---|---|---|---|
| Buttfield Carey | $432,500 | -- |
Source: Public Records
Mortgage History
| Date | Status | Borrower | Loan Amount |
|---|---|---|---|
| Open | Buttfield Carey | $410,875 |
Source: Public Records
Tax History Compared to Growth
Tax History
| Year | Tax Paid | Tax Assessment Tax Assessment Total Assessment is a certain percentage of the fair market value that is determined by local assessors to be the total taxable value of land and additions on the property. | Land | Improvement |
|---|---|---|---|---|
| 2025 | $10,984 | $918,400 | $451,100 | $467,300 |
| 2024 | $10,537 | $859,500 | $426,100 | $433,400 |
| 2023 | $10,342 | $818,200 | $400,900 | $417,300 |
| 2022 | $9,969 | $747,300 | $365,700 | $381,600 |
| 2021 | $9,549 | $701,600 | $345,700 | $355,900 |
| 2020 | $8,908 | $654,500 | $315,600 | $338,900 |
| 2019 | $3,896 | $654,500 | $315,600 | $338,900 |
| 2018 | $8,091 | $620,000 | $300,600 | $319,400 |
| 2017 | $7,600 | $563,400 | $265,800 | $297,600 |
| 2016 | $7,195 | $530,200 | $250,800 | $279,400 |
| 2015 | $6,381 | $461,700 | $250,800 | $210,900 |
Source: Public Records
Map
Nearby Homes
- 58 W Central St
- 8 Pitts St
- 49 Summer St
- 8 Floral Avenue Extension
- 8 Floral Ave Unit 8
- 47 High St
- 48 S Main St Unit 7
- 25 Forest Ave
- 15 Church St Unit 3
- 20 Walcott St
- 34 N Main St Unit 2
- 28 Walnut St
- 26 Walnut St
- 4 Willow St
- 58 N Main St Unit 304
- 40 Morse St
- 6B Lincoln St Unit 6B
- 4B Lincoln St Unit 4B
- 5 Wilson St Unit 5A
- 3 Wilson St Unit 3B