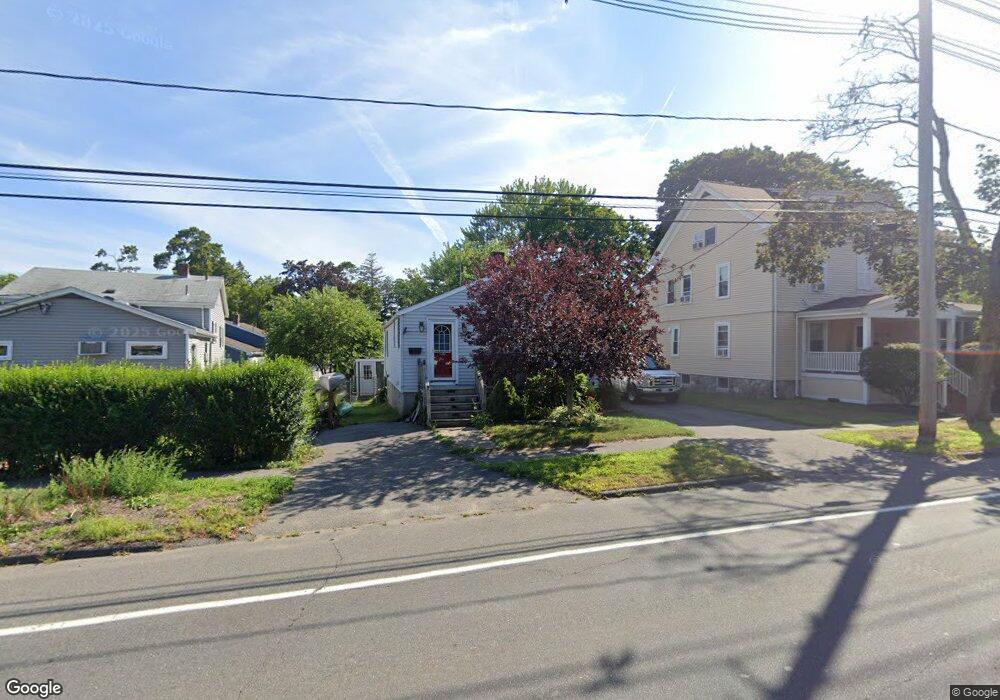
69 Poplar St Danvers, MA 01923
Estimated Value: $414,000 - $524,723
2
Beds
1
Bath
1,020
Sq Ft
$478/Sq Ft
Est. Value
About This Home
This home is located at 69 Poplar St, Danvers, MA 01923 and is currently estimated at $487,681, approximately $478 per square foot. 69 Poplar St is a home located in Essex County with nearby schools including Danvers High School, St. Mary of the Annunciation School, and St. John's Prep.
Ownership History
Date
Name
Owned For
Owner Type
Purchase Details
Closed on
Feb 29, 2008
Sold by
Us Bk
Bought by
Bromm John M and Bromm Shannon
Current Estimated Value
Home Financials for this Owner
Home Financials are based on the most recent Mortgage that was taken out on this home.
Original Mortgage
$189,905
Interest Rate
5.8%
Mortgage Type
Purchase Money Mortgage
Purchase Details
Closed on
Feb 20, 2008
Sold by
Daniels Ernest F
Bought by
Us Bk
Home Financials for this Owner
Home Financials are based on the most recent Mortgage that was taken out on this home.
Original Mortgage
$189,905
Interest Rate
5.8%
Mortgage Type
Purchase Money Mortgage
Purchase Details
Closed on
Jul 17, 1998
Sold by
Rogers Bruce L Est
Bought by
Daniels Ernest F and Daniels Valerie J
Create a Home Valuation Report for This Property
The Home Valuation Report is an in-depth analysis detailing your home's value as well as a comparison with similar homes in the area
Home Values in the Area
Average Home Value in this Area
Purchase History
| Date | Buyer | Sale Price | Title Company |
|---|---|---|---|
| Bromm John M | $199,900 | -- | |
| Us Bk | $325,000 | -- | |
| Daniels Ernest F | $136,000 | -- |
Source: Public Records
Mortgage History
| Date | Status | Borrower | Loan Amount |
|---|---|---|---|
| Open | Daniels Ernest F | $176,500 | |
| Closed | Daniels Ernest F | $189,905 |
Source: Public Records
Tax History
| Year | Tax Paid | Tax Assessment Tax Assessment Total Assessment is a certain percentage of the fair market value that is determined by local assessors to be the total taxable value of land and additions on the property. | Land | Improvement |
|---|---|---|---|---|
| 2025 | $4,888 | $444,800 | $296,500 | $148,300 |
| 2024 | $4,922 | $443,000 | $296,500 | $146,500 |
| 2023 | $4,625 | $393,600 | $263,000 | $130,600 |
| 2022 | $4,399 | $347,500 | $229,400 | $118,100 |
| 2021 | $4,092 | $306,500 | $208,100 | $98,400 |
| 2020 | $3,723 | $285,100 | $201,400 | $83,700 |
| 2019 | $3,694 | $278,200 | $194,700 | $83,500 |
| 2018 | $3,556 | $262,600 | $189,100 | $73,500 |
| 2017 | $3,519 | $248,000 | $175,700 | $72,300 |
| 2016 | $3,357 | $236,400 | $167,900 | $68,500 |
| 2015 | $3,113 | $208,800 | $145,500 | $63,300 |
Source: Public Records
Map
Nearby Homes
Your Personal Tour Guide
Ask me questions while you tour the home.