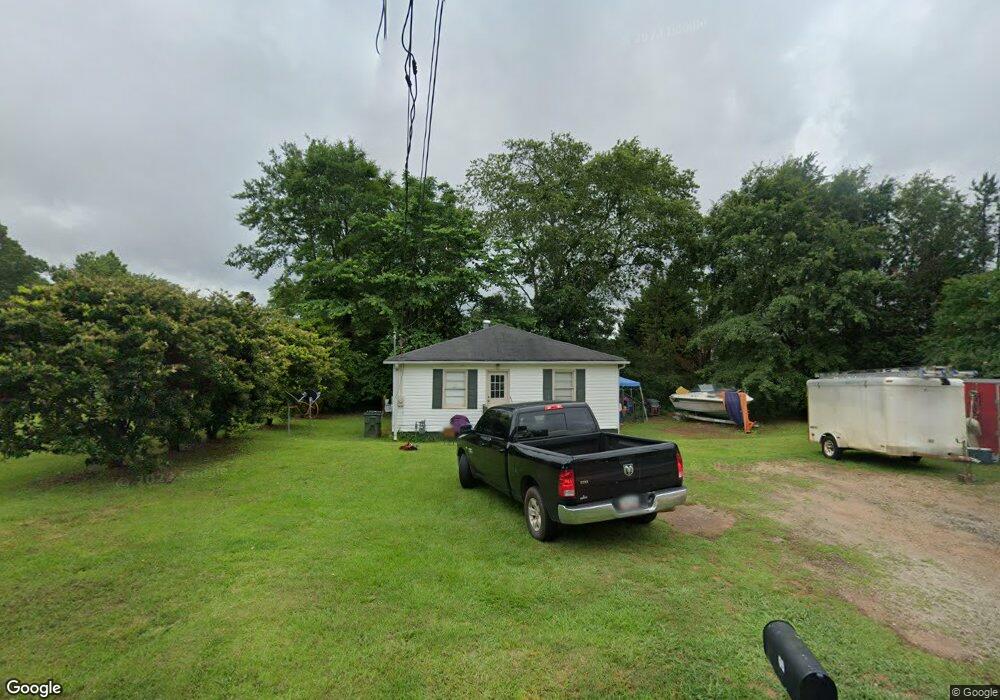
69 Powerhouse Rd Forsyth, GA 31029
Estimated Value: $86,000 - $176,000
--
Bed
2
Baths
1,100
Sq Ft
$115/Sq Ft
Est. Value
About This Home
This home is located at 69 Powerhouse Rd, Forsyth, GA 31029 and is currently estimated at $126,853, approximately $115 per square foot. 69 Powerhouse Rd is a home located in Monroe County with nearby schools including T.G. Scott Elementary School and Mary Persons High School.
Create a Home Valuation Report for This Property
The Home Valuation Report is an in-depth analysis detailing your home's value as well as a comparison with similar homes in the area
Home Values in the Area
Average Home Value in this Area
Tax History Compared to Growth
Tax History
| Year | Tax Paid | Tax Assessment Tax Assessment Total Assessment is a certain percentage of the fair market value that is determined by local assessors to be the total taxable value of land and additions on the property. | Land | Improvement |
|---|---|---|---|---|
| 2024 | $650 | $21,560 | $2,680 | $18,880 |
| 2023 | $561 | $18,400 | $2,680 | $15,720 |
| 2022 | $544 | $18,400 | $2,680 | $15,720 |
| 2021 | $562 | $18,400 | $2,680 | $15,720 |
| 2020 | $584 | $18,400 | $2,680 | $15,720 |
| 2019 | $588 | $18,400 | $2,680 | $15,720 |
| 2018 | $590 | $18,400 | $2,680 | $15,720 |
| 2017 | $590 | $18,400 | $2,680 | $15,720 |
| 2016 | $564 | $18,400 | $2,680 | $15,720 |
| 2015 | $537 | $18,400 | $2,680 | $15,720 |
| 2014 | $529 | $18,400 | $2,680 | $15,720 |
Source: Public Records
Map
Nearby Homes
- 3487 Georgia 42
- 3271 Georgia 42
- 3471 Georgia 42
- 225 N Indian Springs Dr
- 200 Indian Springs Dr
- 24 George St
- 47 Ensign Rd
- 205 Solomon St
- 4616 Capulet Ct
- 5407 Felles Way Unit 356
- 81 Langston Ave
- 5399 Felles Way Unit 358
- 5399 Felles Way
- 5393 Felles Way Unit 359
- 84 Hillsdale Rd
- 5387 Felles Way
- 5387 Felles Way Unit 360
- 397 Ensign Rd
- 333 W Main St
- Cypress Plan at Juliette Crossing
- 185 N Frontage Rd
- 260 Powerhouse Rd
- 71 Powerhouse Rd
- 83 North Dr
- 40 Colvin Dr
- 15 Pineview Cir
- 287 N Frontage Rd
- 491 Carya Ln
- 20 Colvin Dr
- 26 Pineview Cir
- 81 Powerhouse Rd
- 13 Pinecrest Dr
- 30 Colvin Dr
- 495 Carya Ln
- 464 Harold Hill St
- 255 N Frontage Rd
- 3391 Highway 42 N
- 17 Pinecrest Dr
- 15 Harold Hill
- 15 Harold Hill Unit 1