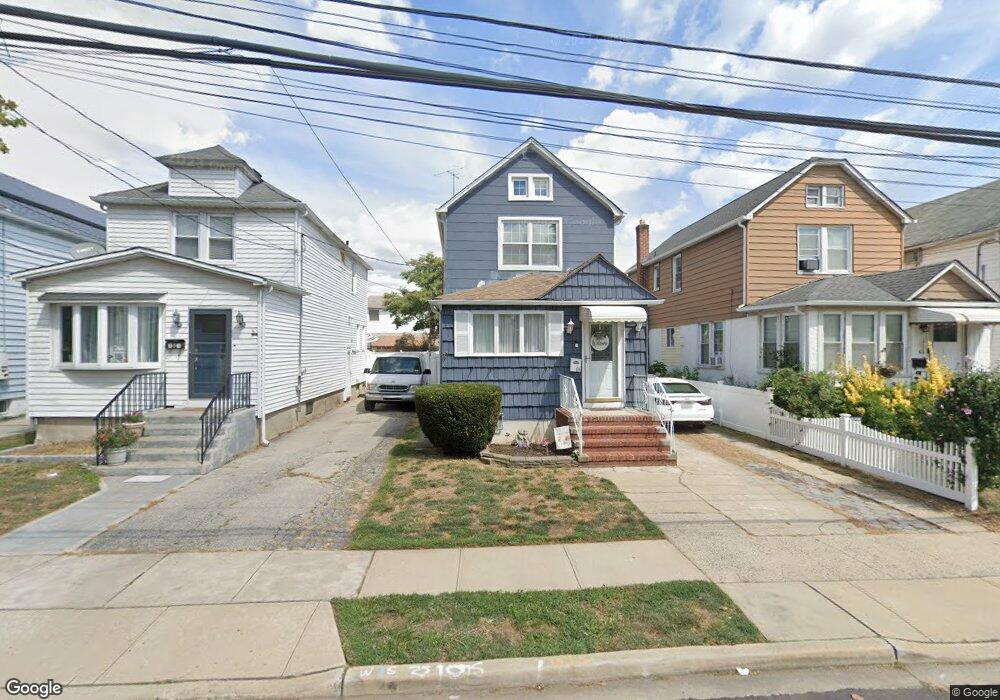
69 Putnam Ave Valley Stream, NY 11580
Estimated Value: $617,000 - $629,734
--
Bed
1
Bath
1,248
Sq Ft
$499/Sq Ft
Est. Value
About This Home
This home is located at 69 Putnam Ave, Valley Stream, NY 11580 and is currently estimated at $623,367, approximately $499 per square foot. 69 Putnam Ave is a home located in Nassau County with nearby schools including Hamza Academy, Cheder at the Ohel, and Martin De Porres High School.
Ownership History
Date
Name
Owned For
Owner Type
Purchase Details
Closed on
Mar 7, 2025
Sold by
Ramiall Joseph and Scherr Jennifer
Bought by
Ramiall Joseph and Ramiall Jennifer
Current Estimated Value
Purchase Details
Closed on
Jul 29, 2011
Sold by
Colgan Jane M
Bought by
Ramlall Joseph and Scherr Jennifer
Home Financials for this Owner
Home Financials are based on the most recent Mortgage that was taken out on this home.
Original Mortgage
$194,930
Outstanding Balance
$136,362
Interest Rate
4.87%
Mortgage Type
FHA
Estimated Equity
$487,005
Create a Home Valuation Report for This Property
The Home Valuation Report is an in-depth analysis detailing your home's value as well as a comparison with similar homes in the area
Home Values in the Area
Average Home Value in this Area
Purchase History
| Date | Buyer | Sale Price | Title Company |
|---|---|---|---|
| Ramiall Joseph | -- | Titlevest | |
| Ramiall Joseph | -- | Titlevest | |
| Ramlall Joseph | $200,000 | -- | |
| Ramlall Joseph | $200,000 | -- | |
| Ramlall Joseph | $200,000 | -- |
Source: Public Records
Mortgage History
| Date | Status | Borrower | Loan Amount |
|---|---|---|---|
| Open | Ramlall Joseph | $194,930 | |
| Closed | Ramlall Joseph | $194,930 |
Source: Public Records
Tax History Compared to Growth
Tax History
| Year | Tax Paid | Tax Assessment Tax Assessment Total Assessment is a certain percentage of the fair market value that is determined by local assessors to be the total taxable value of land and additions on the property. | Land | Improvement |
|---|---|---|---|---|
| 2025 | $8,408 | $429 | $141 | $288 |
| 2024 | $1,718 | $429 | $141 | $288 |
| 2023 | $7,065 | $429 | $141 | $288 |
| 2022 | $7,065 | $429 | $141 | $288 |
| 2021 | $9,908 | $411 | $135 | $276 |
| 2020 | $7,394 | $623 | $412 | $211 |
| 2019 | $7,512 | $653 | $432 | $221 |
| 2018 | $7,405 | $653 | $0 | $0 |
| 2017 | $5,144 | $653 | $432 | $221 |
| 2016 | $6,634 | $653 | $432 | $221 |
| 2015 | $1,463 | $653 | $432 | $221 |
| 2014 | $1,463 | $653 | $432 | $221 |
| 2013 | $1,474 | $707 | $432 | $275 |
Source: Public Records
Map
Nearby Homes