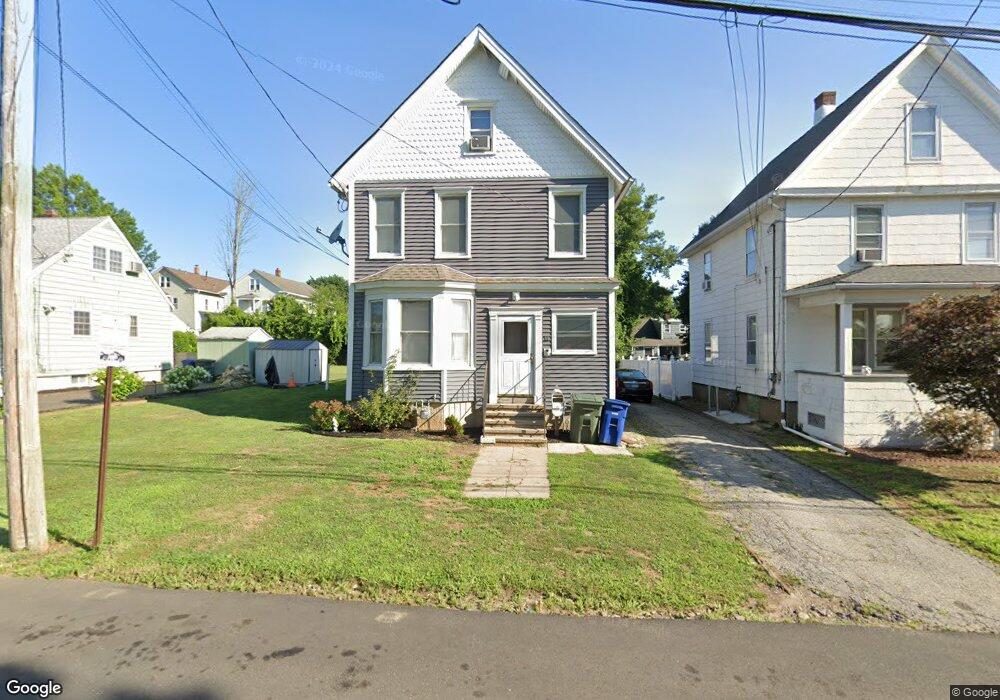
69 Quarry St Bridgeport, CT 06606
North End NeighborhoodEstimated Value: $386,000 - $518,000
4
Beds
2
Baths
1,824
Sq Ft
$241/Sq Ft
Est. Value
About This Home
This home is located at 69 Quarry St, Bridgeport, CT 06606 and is currently estimated at $439,711, approximately $241 per square foot. 69 Quarry St is a home located in Fairfield County with nearby schools including Blackham School, Central High School, and St Andrew School.
Ownership History
Date
Name
Owned For
Owner Type
Purchase Details
Closed on
Dec 16, 2004
Sold by
Coyle Ann
Bought by
Coyle Patrick
Current Estimated Value
Home Financials for this Owner
Home Financials are based on the most recent Mortgage that was taken out on this home.
Original Mortgage
$130,200
Outstanding Balance
$65,725
Interest Rate
5.85%
Estimated Equity
$373,986
Create a Home Valuation Report for This Property
The Home Valuation Report is an in-depth analysis detailing your home's value as well as a comparison with similar homes in the area
Home Values in the Area
Average Home Value in this Area
Purchase History
| Date | Buyer | Sale Price | Title Company |
|---|---|---|---|
| Coyle Patrick | $210,000 | -- | |
| Coyle Patrick | $210,000 | -- |
Source: Public Records
Mortgage History
| Date | Status | Borrower | Loan Amount |
|---|---|---|---|
| Open | Coyle Patrick | $42,000 | |
| Open | Coyle Patrick | $130,200 | |
| Closed | Coyle Patrick | $130,200 |
Source: Public Records
Tax History Compared to Growth
Tax History
| Year | Tax Paid | Tax Assessment Tax Assessment Total Assessment is a certain percentage of the fair market value that is determined by local assessors to be the total taxable value of land and additions on the property. | Land | Improvement |
|---|---|---|---|---|
| 2025 | $6,821 | $156,980 | $64,770 | $92,210 |
| 2024 | $6,821 | $156,980 | $64,770 | $92,210 |
| 2023 | $6,821 | $156,980 | $64,770 | $92,210 |
| 2022 | $6,821 | $156,980 | $64,770 | $92,210 |
| 2021 | $6,821 | $156,980 | $64,770 | $92,210 |
| 2020 | $5,781 | $107,070 | $39,240 | $67,830 |
| 2019 | $5,781 | $107,070 | $39,240 | $67,830 |
| 2018 | $5,821 | $107,070 | $39,240 | $67,830 |
| 2017 | $5,821 | $107,070 | $39,240 | $67,830 |
| 2016 | $5,821 | $107,070 | $39,240 | $67,830 |
| 2015 | $5,207 | $123,400 | $39,590 | $83,810 |
| 2014 | $5,207 | $123,400 | $39,590 | $83,810 |
Source: Public Records
Map
Nearby Homes
- 79 Quarry St
- 87 Quarry St
- 68 E Thorme St
- 49 Quarry St
- 84 E Thorme St
- 41 Quarry St
- 48 E Thorme St
- 40 E Thorme St
- 42 E Thorme St Unit 3rd
- 152 N Quarry St
- 152 N Quarry St Unit 2
- 163 N Quarry St
- 34 E Thorme St
- 24 N Quarry St
- 19 Quarry St Unit 21
- 24 E Thorme St
- 170 N Quarry St
- 71 E Thorme St
- 85 E Thorme St
- 90 Stevens St