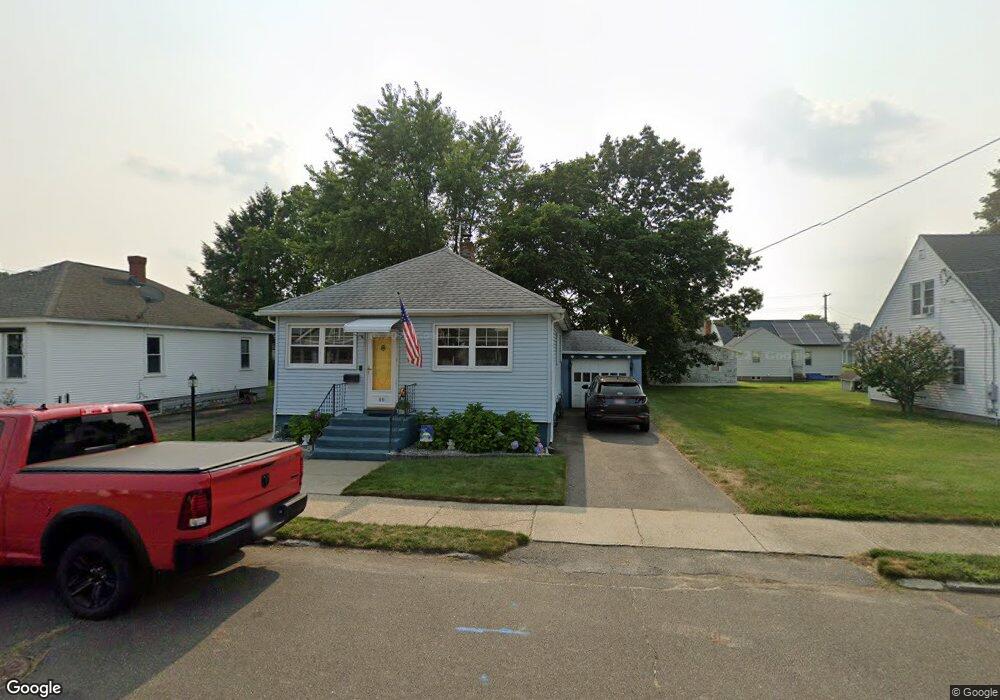
69 Ray St Ludlow, MA 01056
Estimated Value: $265,000 - $348,000
3
Beds
2
Baths
1,000
Sq Ft
$302/Sq Ft
Est. Value
About This Home
This home is located at 69 Ray St, Ludlow, MA 01056 and is currently estimated at $301,878, approximately $301 per square foot. 69 Ray St is a home located in Hampden County with nearby schools including East Street Elementary School, Chapin Street Elementary School, and Paul R. Baird Middle School.
Ownership History
Date
Name
Owned For
Owner Type
Purchase Details
Closed on
Jun 11, 1999
Sold by
Bastos Fernando M and Bastos Maria M
Bought by
Dube Luigina M and Dube Steven L
Current Estimated Value
Home Financials for this Owner
Home Financials are based on the most recent Mortgage that was taken out on this home.
Original Mortgage
$85,276
Outstanding Balance
$22,212
Interest Rate
6.9%
Mortgage Type
Purchase Money Mortgage
Estimated Equity
$279,666
Purchase Details
Closed on
Mar 25, 1988
Sold by
Pinto Joao David
Bought by
Bastos Fernando M
Create a Home Valuation Report for This Property
The Home Valuation Report is an in-depth analysis detailing your home's value as well as a comparison with similar homes in the area
Home Values in the Area
Average Home Value in this Area
Purchase History
We collect this data history from publicly available records. To have your information removed, we recommend requesting removal directly through your county’s website.
| Date | Buyer | Sale Price | Title Company |
|---|---|---|---|
| Dube Luigina M | $86,000 | -- | |
| Dube Luigina M | $86,000 | -- | |
| Bastos Fernando M | $94,000 | -- |
Source: Public Records
Mortgage History
We collect this data history from publicly available records. To have your information removed, we recommend requesting removal directly through your county’s website.
| Date | Status | Borrower | Loan Amount |
|---|---|---|---|
| Open | Bastos Fernando M | $85,276 | |
| Closed | Bastos Fernando M | $85,276 | |
| Previous Owner | Bastos Fernando M | $51,000 | |
| Previous Owner | Bastos Fernando M | $67,500 |
Source: Public Records
Tax History
| Year | Tax Paid | Tax Assessment Tax Assessment Total Assessment is a certain percentage of the fair market value that is determined by local assessors to be the total taxable value of land and additions on the property. | Land | Improvement |
|---|---|---|---|---|
| 2025 | $3,768 | $217,200 | $77,600 | $139,600 |
| 2024 | $3,651 | $201,800 | $77,600 | $124,200 |
| 2023 | $3,416 | $175,100 | $68,100 | $107,000 |
| 2022 | $3,272 | $163,700 | $68,100 | $95,600 |
| 2021 | $3,297 | $156,400 | $68,100 | $88,300 |
| 2020 | $3,161 | $153,300 | $67,100 | $86,200 |
| 2019 | $2,925 | $147,600 | $66,400 | $81,200 |
| 2018 | $2,747 | $144,500 | $66,400 | $78,100 |
| 2017 | $2,663 | $143,700 | $65,100 | $78,600 |
| 2016 | $2,509 | $138,400 | $63,800 | $74,600 |
| 2015 | $2,355 | $136,200 | $63,100 | $73,100 |
Source: Public Records
Map
Nearby Homes
- 111 Kirkland Ave
- 38 Prospect St
- 37 Franklin St
- 84 Chapin Greene Dr
- 72 Chapin Greene Dr
- 350 West Ave Unit 5
- 0 Center St Unit 73415933
- 39 Waters Edge Unit 39
- 2205 Boston Rd Unit O138
- 2205 Boston Rd Unit C20
- 212 Blisswood Village Dr
- 76 Stony Hill Rd
- 24 Dumaine St
- 26-28 Parker St
- 27 Lodge Ln Unit 27
- 32 Lodge Ln Unit 32
- 56 Cherry Dr Unit 56
- 95 Summer Ave
- 46-48 Milton St
- 295 Main St
Your Personal Tour Guide
Ask me questions while you tour the home.