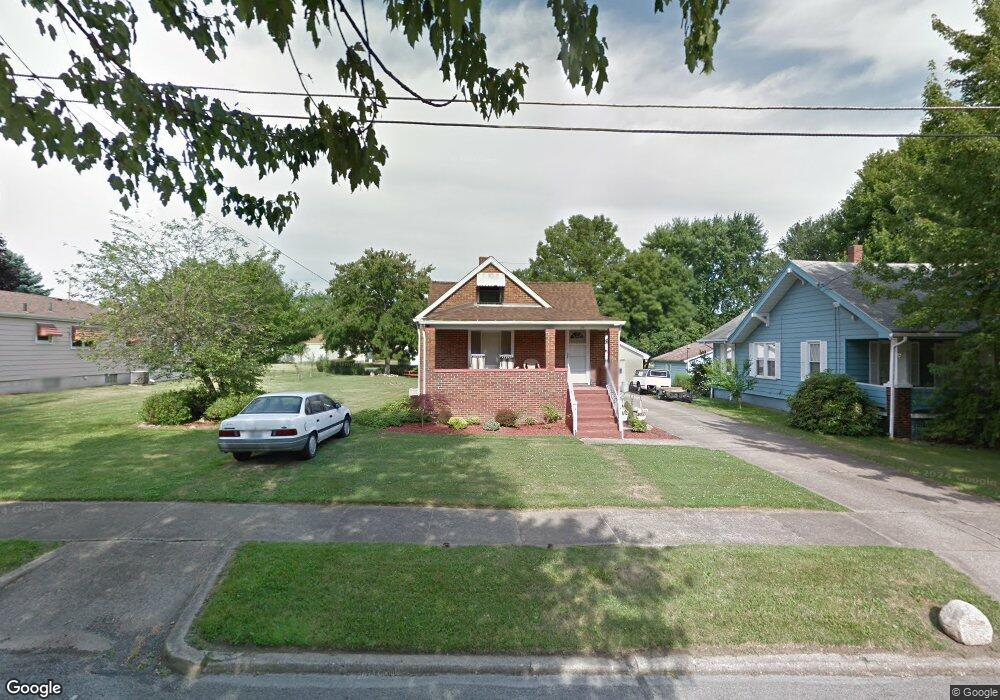
69 Regent St Campbell, OH 44405
Estimated Value: $95,000 - $134,000
2
Beds
2
Baths
1,076
Sq Ft
$108/Sq Ft
Est. Value
About This Home
This home is located at 69 Regent St, Campbell, OH 44405 and is currently estimated at $116,602, approximately $108 per square foot. 69 Regent St is a home located in Mahoning County with nearby schools including Campbell Elementary School, Memorial High School, and Northeast Ohio Impact Academy.
Ownership History
Date
Name
Owned For
Owner Type
Purchase Details
Closed on
Jan 11, 2021
Sold by
Rozum Edward E
Bought by
Daly Nicholas Cameron
Current Estimated Value
Home Financials for this Owner
Home Financials are based on the most recent Mortgage that was taken out on this home.
Original Mortgage
$77,838
Interest Rate
3.05%
Mortgage Type
FHA
Purchase Details
Closed on
May 2, 2008
Sold by
Secretary Of Housing & Urban Development
Bought by
Rozum Edward E
Purchase Details
Closed on
Sep 2, 1994
Sold by
Lentine Frank J
Bought by
Williams Patrick M and Williams Teresa L
Home Financials for this Owner
Home Financials are based on the most recent Mortgage that was taken out on this home.
Original Mortgage
$37,397
Interest Rate
8.59%
Mortgage Type
FHA
Purchase Details
Closed on
Jun 19, 1989
Bought by
Lentine Frank
Create a Home Valuation Report for This Property
The Home Valuation Report is an in-depth analysis detailing your home's value as well as a comparison with similar homes in the area
Home Values in the Area
Average Home Value in this Area
Purchase History
| Date | Buyer | Sale Price | Title Company |
|---|---|---|---|
| Daly Nicholas Cameron | $85,000 | None Available | |
| Rozum Edward E | $12,000 | Lakeside Title & Escrow Agen | |
| Williams Patrick M | $36,000 | -- | |
| Lentine Frank | $32,000 | -- |
Source: Public Records
Mortgage History
| Date | Status | Borrower | Loan Amount |
|---|---|---|---|
| Previous Owner | Daly Nicholas Cameron | $77,838 | |
| Previous Owner | Williams Patrick M | $37,397 |
Source: Public Records
Tax History
| Year | Tax Paid | Tax Assessment Tax Assessment Total Assessment is a certain percentage of the fair market value that is determined by local assessors to be the total taxable value of land and additions on the property. | Land | Improvement |
|---|---|---|---|---|
| 2025 | $1,444 | $27,530 | $2,350 | $25,180 |
| 2024 | $1,445 | $27,530 | $2,350 | $25,180 |
| 2023 | $1,427 | $27,530 | $2,350 | $25,180 |
| 2022 | $734 | $11,820 | $2,350 | $9,470 |
| 2021 | $686 | $11,820 | $2,350 | $9,470 |
| 2020 | $697 | $11,820 | $2,350 | $9,470 |
| 2019 | $694 | $10,460 | $2,080 | $8,380 |
| 2018 | $711 | $10,460 | $2,080 | $8,380 |
| 2017 | $524 | $10,460 | $2,080 | $8,380 |
| 2016 | $850 | $13,350 | $2,360 | $10,990 |
| 2015 | $833 | $13,350 | $2,360 | $10,990 |
| 2014 | $831 | $13,350 | $2,360 | $10,990 |
| 2013 | $814 | $13,350 | $2,360 | $10,990 |
Source: Public Records
Map
Nearby Homes
- 121 Princess St
- 151 Regent St
- 159 Piccadilly St
- 165 Piccadilly St
- 664 Tenney Ave
- 204 Tremble Ave
- 291 Struthers Liberty Rd
- 190 Struthers Liberty Rd
- 127 Blackburn St
- 628 Matawan Dr
- 97 Rosary Dr
- 101 Pin Oak Place
- 3343 Lawnview Ave
- 459 Tenney Ave
- 3307 Upland Ave
- 0 Penhale Ave
- 653 Chapel Ln
- 541 Blossom Ave
- 130 12th St
- 374 Tenney Ave
Your Personal Tour Guide
Ask me questions while you tour the home.