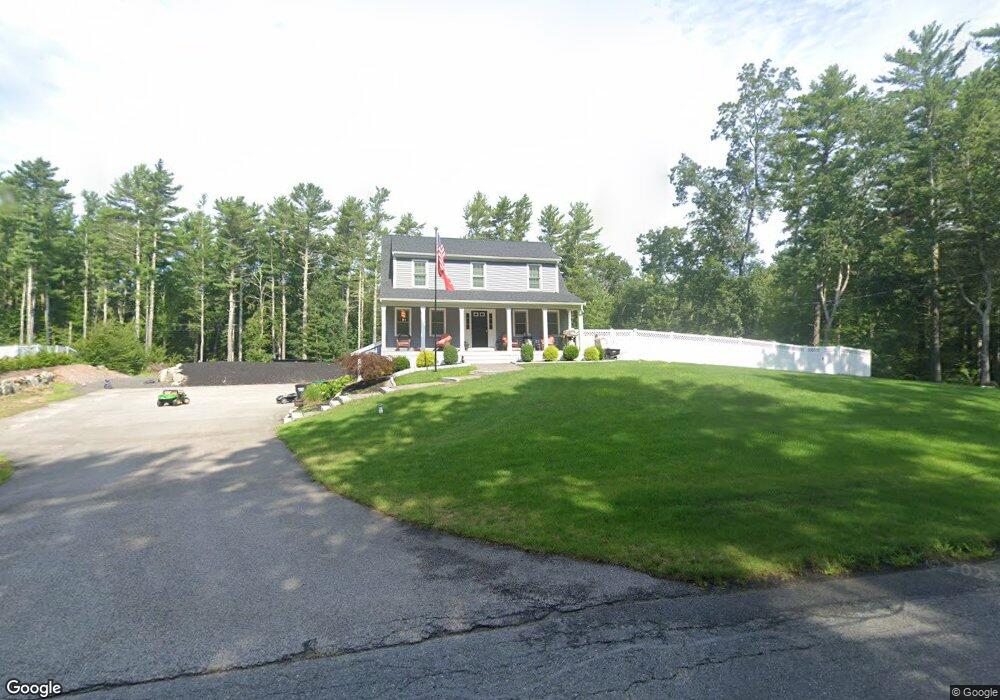
69 Ring Rd Kingston, MA 02364
Estimated Value: $690,596 - $828,000
3
Beds
3
Baths
1,600
Sq Ft
$458/Sq Ft
Est. Value
About This Home
This home is located at 69 Ring Rd, Kingston, MA 02364 and is currently estimated at $732,399, approximately $457 per square foot. 69 Ring Rd is a home located in Plymouth County with nearby schools including Silver Lake Regional High School, Kingston Elementary School, and Kingston Intermediate School.
Ownership History
Date
Name
Owned For
Owner Type
Purchase Details
Closed on
Jun 15, 2021
Sold by
Kls 69 Llc
Bought by
Wrightington Stephen and Comeau Jessica
Current Estimated Value
Home Financials for this Owner
Home Financials are based on the most recent Mortgage that was taken out on this home.
Original Mortgage
$360,000
Outstanding Balance
$325,935
Interest Rate
2.9%
Mortgage Type
Purchase Money Mortgage
Estimated Equity
$406,464
Purchase Details
Closed on
Oct 30, 2015
Sold by
K & G Development Corp
Bought by
Kls 69 Llc
Purchase Details
Closed on
May 1, 2015
Sold by
Est Carvalho Doris M and Carvalho Donald
Bought by
K&G Development Corp
Home Financials for this Owner
Home Financials are based on the most recent Mortgage that was taken out on this home.
Original Mortgage
$315,000
Interest Rate
3.76%
Mortgage Type
New Conventional
Purchase Details
Closed on
Feb 10, 2011
Sold by
Carvalho Doris M
Bought by
Fernandes Domingo M
Create a Home Valuation Report for This Property
The Home Valuation Report is an in-depth analysis detailing your home's value as well as a comparison with similar homes in the area
Home Values in the Area
Average Home Value in this Area
Purchase History
| Date | Buyer | Sale Price | Title Company |
|---|---|---|---|
| Wrightington Stephen | $450,000 | None Available | |
| Kls 69 Llc | $400,000 | -- | |
| K&G Development Corp | $135,000 | -- | |
| Fernandes Domingo M | $32,000 | -- |
Source: Public Records
Mortgage History
| Date | Status | Borrower | Loan Amount |
|---|---|---|---|
| Open | Wrightington Stephen | $360,000 | |
| Previous Owner | K&G Development Corp | $315,000 |
Source: Public Records
Tax History
| Year | Tax Paid | Tax Assessment Tax Assessment Total Assessment is a certain percentage of the fair market value that is determined by local assessors to be the total taxable value of land and additions on the property. | Land | Improvement |
|---|---|---|---|---|
| 2025 | $8,632 | $665,500 | $240,500 | $425,000 |
| 2024 | $7,601 | $598,000 | $211,600 | $386,400 |
| 2023 | $7,317 | $547,700 | $211,600 | $336,100 |
| 2022 | $7,168 | $491,600 | $194,100 | $297,500 |
| 2021 | $7,131 | $443,500 | $194,100 | $249,400 |
| 2020 | $7,074 | $434,500 | $194,100 | $240,400 |
| 2019 | $6,954 | $422,500 | $194,100 | $228,400 |
| 2018 | $6,508 | $395,600 | $194,100 | $201,500 |
| 2017 | $6,428 | $389,600 | $188,900 | $200,700 |
| 2016 | $3,223 | $183,000 | $173,000 | $10,000 |
| 2015 | $2,931 | $173,000 | $173,000 | $0 |
| 2014 | $2,886 | $173,000 | $173,000 | $0 |
Source: Public Records
Map
Nearby Homes
- 83 Wapping Rd
- 1 Oldfield Dr
- 412 Elm St
- 46 Foxworth Ln
- 167 Grove St
- 1 Watermans Ln
- 278 Main St
- 44 Meeting House Rd
- 15 Forest St
- Lot 17-1 Howland's Ln
- 342 Country Club Way
- 28 Brook St
- 149 Summer St
- 16 Copper Beech Dr Marion Dr
- 0 Spring St
- 53 Beechwood Rd
- 7 Green Holly Dr
- 3 Natureway Cir
- 40 Landing Rd
- 42 Christmas Tree Ln
Your Personal Tour Guide
Ask me questions while you tour the home.