69 Robin Rd Unit 4 Carpentersville, IL 60110
Estimated Value: $230,000 - $264,348
3
Beds
1
Bath
1,000
Sq Ft
$244/Sq Ft
Est. Value
About This Home
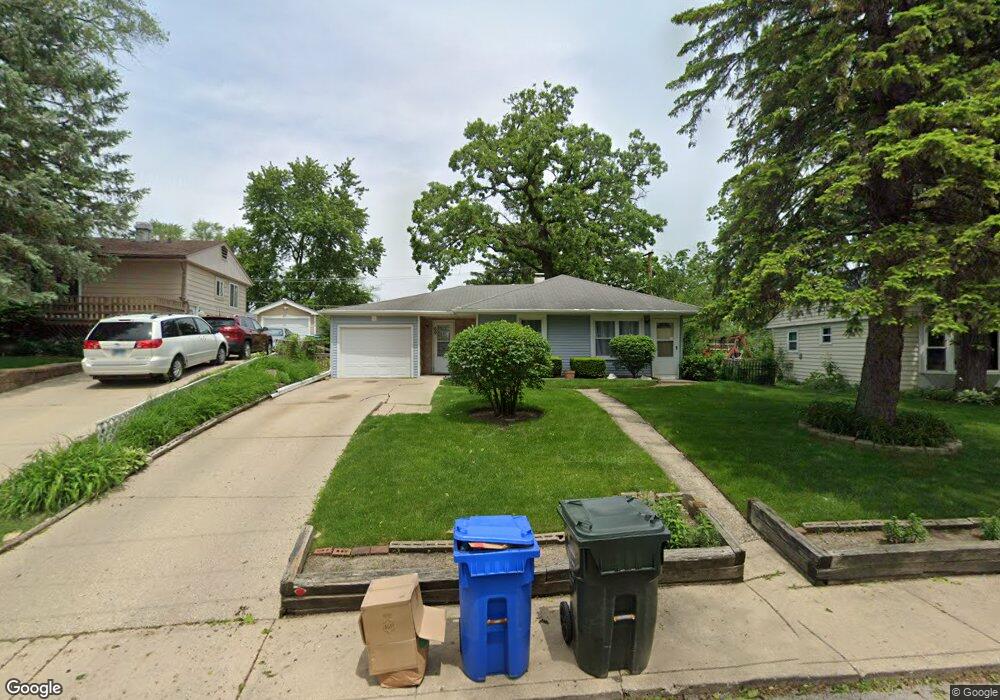
This home is located at 69 Robin Rd Unit 4, Carpentersville, IL 60110 and is currently estimated at $243,837, approximately $243 per square foot. 69 Robin Rd Unit 4 is a home located in Kane County with nearby schools including Meadowdale Elementary School, Carpentersville Middle School, and Dundee-Crown High School.
Ownership History
Date
Name
Owned For
Owner Type
Purchase Details
Closed on
Aug 31, 2011
Sold by
North Star Trust Company
Bought by
Lopez Juan A
Current Estimated Value
Home Financials for this Owner
Home Financials are based on the most recent Mortgage that was taken out on this home.
Original Mortgage
$70,100
Outstanding Balance
$48,551
Interest Rate
4.5%
Mortgage Type
FHA
Estimated Equity
$195,286
Purchase Details
Closed on
Feb 24, 2000
Sold by
Wolter Anna D
Bought by
Cardunal Svgs Bank Fsb and Trust #98-181
Create a Home Valuation Report for This Property
The Home Valuation Report is an in-depth analysis detailing your home's value as well as a comparison with similar homes in the area
Home Values in the Area
Average Home Value in this Area
Purchase History
| Date | Buyer | Sale Price | Title Company |
|---|---|---|---|
| Lopez Juan A | $72,000 | Chicago Title Insurance Co | |
| Cardunal Svgs Bank Fsb | -- | -- |
Source: Public Records
Mortgage History
| Date | Status | Borrower | Loan Amount |
|---|---|---|---|
| Open | Lopez Juan A | $70,100 |
Source: Public Records
Tax History Compared to Growth
Tax History
| Year | Tax Paid | Tax Assessment Tax Assessment Total Assessment is a certain percentage of the fair market value that is determined by local assessors to be the total taxable value of land and additions on the property. | Land | Improvement |
|---|---|---|---|---|
| 2024 | $4,581 | $68,490 | $12,553 | $55,937 |
| 2023 | $4,506 | $61,625 | $11,295 | $50,330 |
| 2022 | $4,133 | $53,464 | $11,295 | $42,169 |
| 2021 | $4,029 | $50,481 | $10,665 | $39,816 |
| 2020 | $3,960 | $49,346 | $10,425 | $38,921 |
| 2019 | $3,865 | $46,845 | $9,897 | $36,948 |
| 2018 | $3,390 | $40,156 | $9,701 | $30,455 |
| 2017 | $3,238 | $37,564 | $9,075 | $28,489 |
| 2016 | $2,903 | $32,384 | $8,787 | $23,597 |
| 2015 | -- | $25,298 | $8,234 | $17,064 |
| 2014 | -- | $22,822 | $8,007 | $14,815 |
| 2013 | -- | $23,520 | $8,252 | $15,268 |
Source: Public Records
Map
Nearby Homes