Estimated Value: $301,000 - $324,000
3
Beds
1
Bath
1,210
Sq Ft
$259/Sq Ft
Est. Value
About This Home
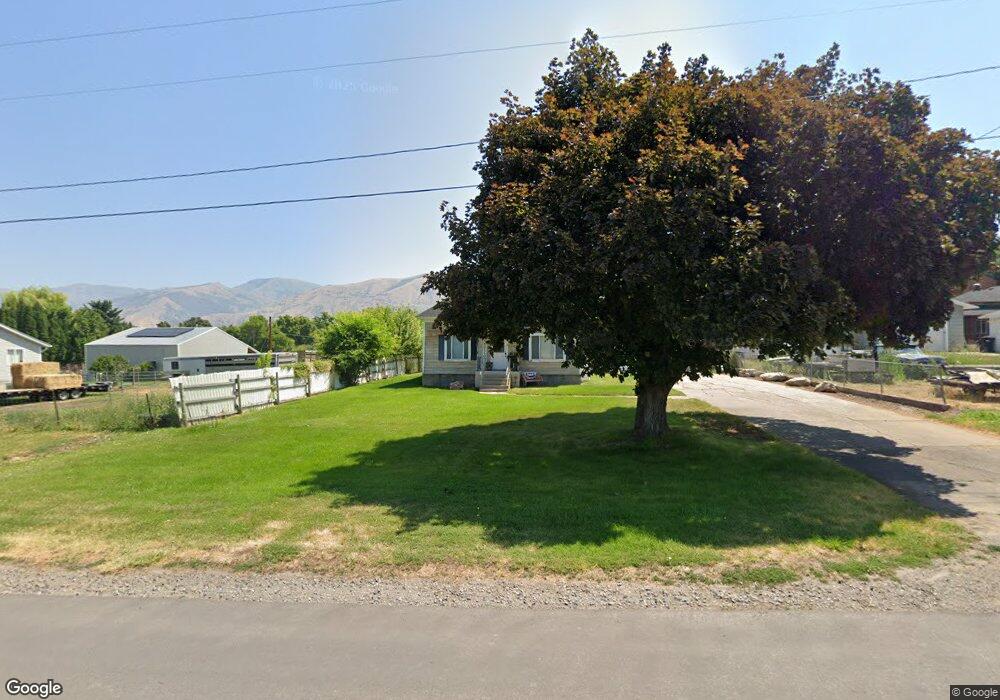
This home is located at 69 S 100 E, Hyrum, UT 84319 and is currently estimated at $313,932, approximately $259 per square foot. 69 S 100 E is a home located in Cache County with nearby schools including Lincoln School, South Cache Middle School, and Mountain Crest High School.
Ownership History
Date
Name
Owned For
Owner Type
Purchase Details
Closed on
Oct 30, 2024
Sold by
Checketts Curtis
Bought by
69 S Hyrum Llc
Current Estimated Value
Purchase Details
Closed on
Sep 16, 2014
Sold by
Gillies Trevor G and Gillies Megan
Bought by
Jpmorgan Chase Bank National Association
Purchase Details
Closed on
Dec 17, 2009
Sold by
Mountain Range Investments Llc
Bought by
Gillies Trevor G and Gillies Megan
Home Financials for this Owner
Home Financials are based on the most recent Mortgage that was taken out on this home.
Original Mortgage
$140,760
Interest Rate
4.91%
Mortgage Type
New Conventional
Purchase Details
Closed on
Jul 9, 2009
Sold by
Briggs Lori
Bought by
Mountain Range Investments Llc
Purchase Details
Closed on
Jul 8, 2009
Sold by
Briggs Dennis Ray
Bought by
Briggs Lori
Create a Home Valuation Report for This Property
The Home Valuation Report is an in-depth analysis detailing your home's value as well as a comparison with similar homes in the area
Home Values in the Area
Average Home Value in this Area
Purchase History
| Date | Buyer | Sale Price | Title Company |
|---|---|---|---|
| 69 S Hyrum Llc | -- | Hickman Land Title | |
| Jpmorgan Chase Bank National Association | $98,175 | Etitle Insurance Agency | |
| Gillies Trevor G | -- | Northern Title Company | |
| Mountain Range Investments Llc | -- | American Secure Title | |
| Briggs Lori | -- | American Secure Title |
Source: Public Records
Mortgage History
| Date | Status | Borrower | Loan Amount |
|---|---|---|---|
| Previous Owner | Gillies Trevor G | $140,760 |
Source: Public Records
Tax History
| Year | Tax Paid | Tax Assessment Tax Assessment Total Assessment is a certain percentage of the fair market value that is determined by local assessors to be the total taxable value of land and additions on the property. | Land | Improvement |
|---|---|---|---|---|
| 2025 | $108 | $155,420 | $0 | $0 |
| 2024 | $1,159 | $155,460 | $0 | $0 |
| 2023 | $1,168 | $149,765 | $0 | $0 |
| 2022 | $1,234 | $151,605 | $0 | $0 |
| 2021 | $1,140 | $215,776 | $66,100 | $149,676 |
| 2020 | $1,020 | $181,236 | $66,100 | $115,136 |
| 2019 | $935 | $156,256 | $41,120 | $115,136 |
| 2018 | $891 | $143,920 | $41,120 | $102,800 |
| 2017 | $883 | $73,985 | $0 | $0 |
| 2016 | $903 | $73,985 | $0 | $0 |
| 2015 | $905 | $73,985 | $0 | $0 |
| 2014 | $883 | $73,820 | $0 | $0 |
| 2013 | -- | $73,820 | $0 | $0 |
Source: Public Records
Map
Nearby Homes
Your Personal Tour Guide
Ask me questions while you tour the home.