69 S 1200 W Ephraim, UT 84627
Estimated Value: $523,000 - $636,000
4
Beds
3
Baths
2,845
Sq Ft
$201/Sq Ft
Est. Value
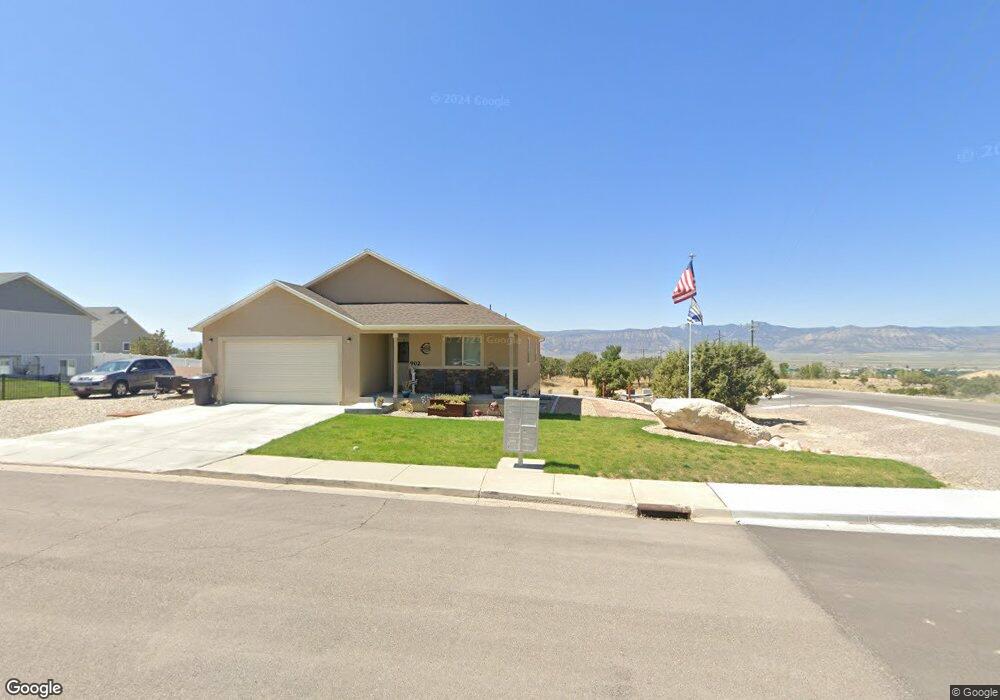
About This Home
This home is located at 69 S 1200 W, Ephraim, UT 84627 and is currently estimated at $571,804, approximately $200 per square foot. 69 S 1200 W is a home located in Sanpete County.
Ownership History
Date
Name
Owned For
Owner Type
Purchase Details
Closed on
Apr 19, 2019
Sold by
Robin Smith
Bought by
Thomson Robert A
Current Estimated Value
Home Financials for this Owner
Home Financials are based on the most recent Mortgage that was taken out on this home.
Original Mortgage
$367,535
Outstanding Balance
$323,779
Interest Rate
4.4%
Mortgage Type
New Conventional
Estimated Equity
$248,025
Purchase Details
Closed on
Mar 10, 2014
Sold by
Gary J Gary J and Chabot Terri
Bought by
Smith Duane P and Smith Robin Elise
Purchase Details
Closed on
Feb 8, 2006
Sold by
Wynder Suzette
Bought by
Bowden Gary J and Chabot Terri R
Purchase Details
Closed on
Dec 27, 2005
Sold by
Wynder Suzette
Bought by
Bowden Gary J and Chabot Terri R
Create a Home Valuation Report for This Property
The Home Valuation Report is an in-depth analysis detailing your home's value as well as a comparison with similar homes in the area
Home Values in the Area
Average Home Value in this Area
Purchase History
| Date | Buyer | Sale Price | Title Company |
|---|---|---|---|
| Thomson Robert A | $459,418 | First American Title | |
| Smith Duane P | -- | First American Title | |
| Bowden Gary J | -- | -- | |
| Bowden Gary J | -- | -- |
Source: Public Records
Mortgage History
| Date | Status | Borrower | Loan Amount |
|---|---|---|---|
| Open | Thomson Robert A | $367,535 |
Source: Public Records
Tax History Compared to Growth
Tax History
| Year | Tax Paid | Tax Assessment Tax Assessment Total Assessment is a certain percentage of the fair market value that is determined by local assessors to be the total taxable value of land and additions on the property. | Land | Improvement |
|---|---|---|---|---|
| 2024 | $2,578 | $267,395 | $0 | $0 |
| 2023 | $2,562 | $251,075 | $0 | $0 |
| 2022 | $2,614 | $234,101 | $0 | $0 |
| 2021 | $2,475 | $192,184 | $0 | $0 |
| 2020 | $2,028 | $148,909 | $0 | $0 |
| 2019 | $2,147 | $155,732 | $0 | $0 |
| 2018 | $2,158 | $236,608 | $50,651 | $185,957 |
| 2017 | $1,878 | $142,038 | $0 | $0 |
| 2016 | $1,771 | $133,942 | $0 | $0 |
| 2015 | $1,777 | $133,942 | $0 | $0 |
| 2014 | $1,739 | $133,942 | $0 | $0 |
| 2013 | $1,725 | $133,942 | $0 | $0 |
Source: Public Records
Map
Nearby Homes