Estimated Value: $441,160 - $500,000
4
Beds
1
Bath
2,414
Sq Ft
$196/Sq Ft
Est. Value
About This Home
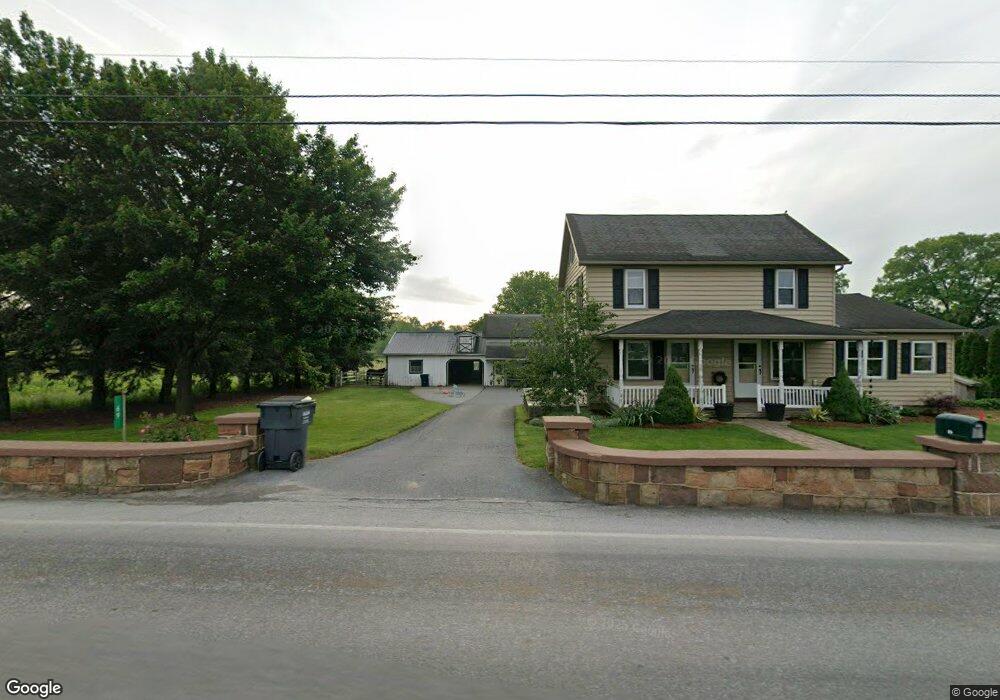
This home is located at 69 S Ronks Rd, Ronks, PA 17572 and is currently estimated at $472,290, approximately $195 per square foot. 69 S Ronks Rd is a home located in Lancaster County with nearby schools including Smoketown Elementary School, Gerald G. Huesken Middle School, and Conestoga Valley High School.
Ownership History
Date
Name
Owned For
Owner Type
Purchase Details
Closed on
Aug 14, 2020
Sold by
Fisher John D and Fisher Fannie L
Bought by
Fisher John D and Fisher Fannie L
Current Estimated Value
Purchase Details
Closed on
Sep 28, 2012
Sold by
Fisher Josh D and Fisher Fannie L
Bought by
Fisher Daniel S
Purchase Details
Closed on
Jan 22, 2001
Sold by
Fisher Samuel G and Fisher Verna L
Bought by
Fisher John D and Fisher Fannie L
Create a Home Valuation Report for This Property
The Home Valuation Report is an in-depth analysis detailing your home's value as well as a comparison with similar homes in the area
Home Values in the Area
Average Home Value in this Area
Purchase History
| Date | Buyer | Sale Price | Title Company |
|---|---|---|---|
| Fisher John D | -- | None Available | |
| Fisher Daniels S | -- | None Available | |
| Fisher John D | -- | None Available | |
| Fisher Daniel S | -- | None Available | |
| Fisher John D | $188,000 | -- |
Source: Public Records
Tax History Compared to Growth
Tax History
| Year | Tax Paid | Tax Assessment Tax Assessment Total Assessment is a certain percentage of the fair market value that is determined by local assessors to be the total taxable value of land and additions on the property. | Land | Improvement |
|---|---|---|---|---|
| 2025 | $4,665 | $230,400 | $85,900 | $144,500 |
| 2024 | $4,665 | $230,400 | $85,900 | $144,500 |
| 2023 | $4,557 | $230,400 | $85,900 | $144,500 |
| 2022 | $4,443 | $230,400 | $85,900 | $144,500 |
| 2021 | $4,287 | $230,400 | $85,900 | $144,500 |
| 2020 | $4,415 | $237,300 | $92,800 | $144,500 |
| 2019 | $4,320 | $237,300 | $92,800 | $144,500 |
| 2018 | $6,165 | $237,300 | $92,800 | $144,500 |
| 2017 | $4,548 | $210,100 | $70,500 | $139,600 |
| 2016 | $4,494 | $210,100 | $70,500 | $139,600 |
| 2015 | $1,148 | $210,100 | $70,500 | $139,600 |
| 2014 | $3,021 | $210,100 | $70,500 | $139,600 |
Source: Public Records
Map
Nearby Homes
- 0 - Lot #2 Paradise Ln
- 2472 Leaman Rd
- 26 Ruth Dr
- 31 Jere Rd
- 3088 Lincoln Hwy E
- 15 S Singer Ave
- 129 Creekview Dr
- 202 N Decatur St
- 2453 Lincoln Hwy E
- 180 S Shenk Ave
- 98 Lancaster Ave
- 0 W Franklin St
- 22 Miller St
- 323 Enterprise Dr
- 24 Miller St
- 7 Pleasant Dr
- 2596 Old Philadelphia Pike
- 339 Enterprise Dr
- 54 Old Orchard Rd
- 38 Old Orchard Rd
- 73 Ranck Ave
- 75 S Ronks Rd
- 70 S Ronks Rd
- 70 S Soudersburg Rd
- 58 S Soudersburg Rd
- 43 S Ronks Rd
- 39 S Ronks Rd
- 50 S Soudersburg Rd
- 2828 Lincoln Hwy E
- 37 Ranck Ave
- 53 S Soudersburg Rd
- 31 S Ronks Rd
- 51 S Soudersburg Rd
- 48 S Soudersburg Rd
- 110 S Ronks Rd
- 44 S Soudersburg Rd
- 112 S Ronks Rd
- 23 S Ronks Rd
- 2704 Bachmantown Rd
- 114 S Ronks Rd