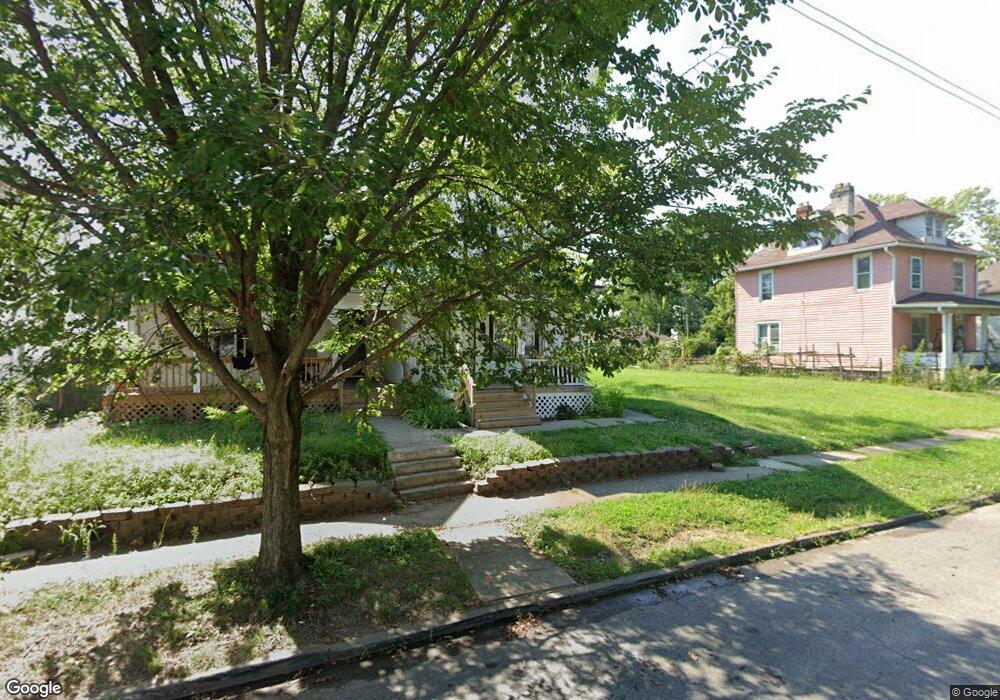
69 S Wheatland Ave Unit 71 Columbus, OH 43204
Central Hilltop NeighborhoodEstimated Value: $157,572 - $230,000
4
Beds
2
Baths
2,040
Sq Ft
$97/Sq Ft
Est. Value
About This Home
This home is located at 69 S Wheatland Ave Unit 71, Columbus, OH 43204 and is currently estimated at $197,143, approximately $96 per square foot. 69 S Wheatland Ave Unit 71 is a home located in Franklin County with nearby schools including Highland Elementary School, Westmoor Middle School, and West High School.
Ownership History
Date
Name
Owned For
Owner Type
Purchase Details
Closed on
Feb 29, 2024
Sold by
Kubinski Thelma Ruth
Bought by
Skytallrealestate Llc
Current Estimated Value
Home Financials for this Owner
Home Financials are based on the most recent Mortgage that was taken out on this home.
Original Mortgage
$184,175
Interest Rate
6.64%
Mortgage Type
Balloon
Purchase Details
Closed on
Dec 1, 2008
Sold by
Kubinski Glen
Bought by
Kubin Properties Llc
Purchase Details
Closed on
Jun 1, 1998
Sold by
Wren Denise R
Bought by
Kubinski Glen
Purchase Details
Closed on
Mar 24, 1995
Sold by
Spellman Norman L
Bought by
Wren Denise R
Home Financials for this Owner
Home Financials are based on the most recent Mortgage that was taken out on this home.
Original Mortgage
$11,615
Interest Rate
8.82%
Mortgage Type
New Conventional
Purchase Details
Closed on
Nov 1, 1984
Create a Home Valuation Report for This Property
The Home Valuation Report is an in-depth analysis detailing your home's value as well as a comparison with similar homes in the area
Home Values in the Area
Average Home Value in this Area
Purchase History
| Date | Buyer | Sale Price | Title Company |
|---|---|---|---|
| Skytallrealestate Llc | -- | Axxis Title Agency | |
| Skytallrealestate Llc | $125,000 | Axxis Title Agency | |
| Kubin Properties Llc | -- | Attorney | |
| Kubinski Glen | $23,000 | -- | |
| Wren Denise R | $11,500 | -- | |
| -- | $10,100 | -- |
Source: Public Records
Mortgage History
| Date | Status | Borrower | Loan Amount |
|---|---|---|---|
| Closed | Skytallrealestate Llc | $184,175 | |
| Previous Owner | Wren Denise R | $11,615 |
Source: Public Records
Tax History Compared to Growth
Tax History
| Year | Tax Paid | Tax Assessment Tax Assessment Total Assessment is a certain percentage of the fair market value that is determined by local assessors to be the total taxable value of land and additions on the property. | Land | Improvement |
|---|---|---|---|---|
| 2024 | $3,422 | $49,390 | $6,270 | $43,120 |
| 2023 | $2,235 | $49,385 | $6,265 | $43,120 |
| 2022 | $1,122 | $21,110 | $3,220 | $17,890 |
| 2021 | $1,124 | $21,110 | $3,220 | $17,890 |
| 2020 | $1,126 | $21,110 | $3,220 | $17,890 |
| 2019 | $1,095 | $17,610 | $2,700 | $14,910 |
| 2018 | $547 | $17,610 | $2,700 | $14,910 |
| 2017 | $1,095 | $17,610 | $2,700 | $14,910 |
| 2016 | $911 | $13,410 | $4,410 | $9,000 |
| 2015 | $415 | $13,410 | $4,410 | $9,000 |
| 2014 | $831 | $13,410 | $4,410 | $9,000 |
| 2013 | $482 | $15,750 | $5,180 | $10,570 |
Source: Public Records
Map
Nearby Homes
- 137 S Highland Ave
- 45 S Oakley Ave
- 95 Midland Ave
- 27 S Oakley Ave
- 151 S Wayne Ave Unit 153
- 216 S Oakley Ave
- 221 S Highland Ave
- 225 S Highland Ave
- 95 S Eureka Ave
- 57 S Eureka Ave
- 34-36 Midland Ave
- 67 N Wheatland Ave
- 226 Clarendon Ave
- 244 Clarendon Ave
- 176 S Terrace Ave
- 121 N Terrace Ave
- 117-119 N Wheatland Ave
- 249 Midland Ave
- 172 Whitethorne Ave
- 224 S Terrace Ave
- 71 S Wheatland Ave
- 75 S Wheatland Ave
- 57 S Wheatland Ave
- 85 1/2 S Wheatland Ave
- 70 S Wheatland Ave Unit 72
- 68 S Oakley Ave
- 64 S Oakley Ave
- 53 S Wheatland Ave
- 54 S Oakley Ave
- 78 S Wheatland Ave
- 66 S Wheatland Ave
- 82 S Wheatland Ave
- 52 S Oakley Ave
- 45 S Wheatland Ave
- 64 S Wheatland Ave
- 52 S Wheatland Ave
- 86 S Wheatland Ave
- 48 S Oakley Ave
- 50-52 S Wheatland Ave
- 50 S Wheatland Ave Unit 52