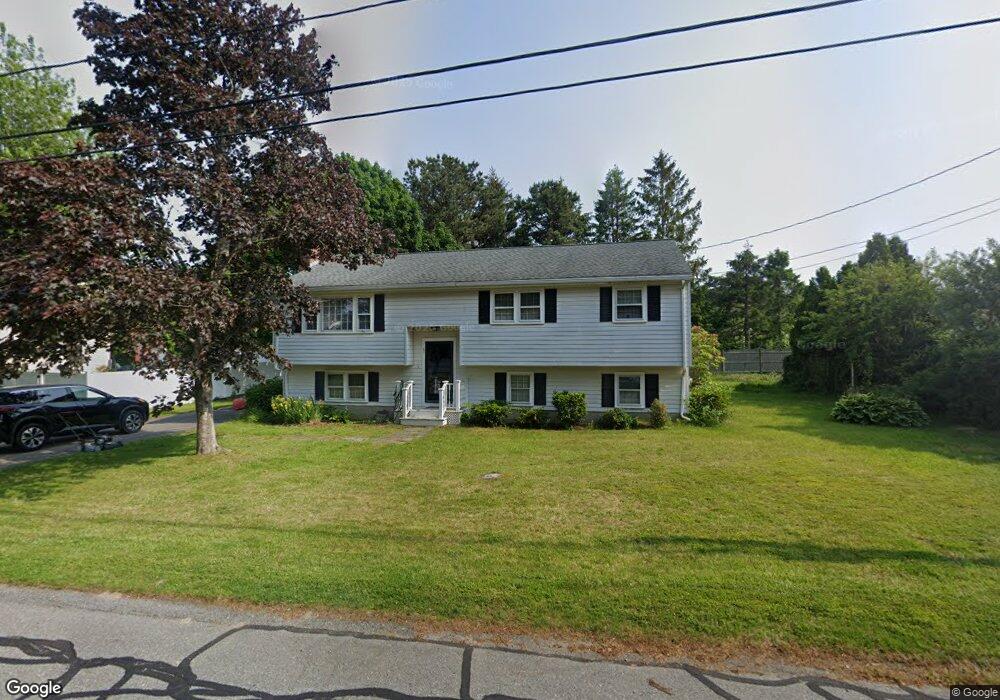
69 Sachem Dr Sagamore Beach, MA 02562
Estimated Value: $535,000 - $621,000
3
Beds
2
Baths
1,660
Sq Ft
$354/Sq Ft
Est. Value
About This Home
This home is located at 69 Sachem Dr, Sagamore Beach, MA 02562 and is currently estimated at $587,794, approximately $354 per square foot. 69 Sachem Dr is a home located in Barnstable County with nearby schools including Bourne High School, Bridgeview Montessori School, and New Testament Christian School.
Ownership History
Date
Name
Owned For
Owner Type
Purchase Details
Closed on
Dec 2, 2022
Sold by
Tudor Susan L
Bought by
Tudor Susan L and Tudor Paul
Current Estimated Value
Home Financials for this Owner
Home Financials are based on the most recent Mortgage that was taken out on this home.
Original Mortgage
$158,565
Outstanding Balance
$153,988
Interest Rate
7.08%
Mortgage Type
New Conventional
Estimated Equity
$433,806
Purchase Details
Closed on
May 29, 1998
Sold by
Ellis Jean K
Bought by
Tudor Susan L
Home Financials for this Owner
Home Financials are based on the most recent Mortgage that was taken out on this home.
Original Mortgage
$108,300
Interest Rate
7.12%
Mortgage Type
Purchase Money Mortgage
Create a Home Valuation Report for This Property
The Home Valuation Report is an in-depth analysis detailing your home's value as well as a comparison with similar homes in the area
Home Values in the Area
Average Home Value in this Area
Purchase History
| Date | Buyer | Sale Price | Title Company |
|---|---|---|---|
| Tudor Susan L | -- | None Available | |
| Tudor Susan L | -- | None Available | |
| Tudor Susan L | -- | None Available | |
| Tudor Susan L | $114,000 | -- | |
| Tudor Susan L | $114,000 | -- |
Source: Public Records
Mortgage History
| Date | Status | Borrower | Loan Amount |
|---|---|---|---|
| Open | Tudor Susan L | $158,565 | |
| Closed | Tudor Susan L | $158,565 | |
| Previous Owner | Tudor Susan L | $122,000 | |
| Previous Owner | Tudor Susan L | $108,300 |
Source: Public Records
Tax History Compared to Growth
Tax History
| Year | Tax Paid | Tax Assessment Tax Assessment Total Assessment is a certain percentage of the fair market value that is determined by local assessors to be the total taxable value of land and additions on the property. | Land | Improvement |
|---|---|---|---|---|
| 2025 | $3,483 | $446,000 | $195,600 | $250,400 |
| 2024 | $3,406 | $424,700 | $186,300 | $238,400 |
| 2023 | $3,313 | $376,000 | $164,800 | $211,200 |
| 2022 | $3,165 | $313,700 | $145,900 | $167,800 |
| 2021 | $3,076 | $285,600 | $132,800 | $152,800 |
| 2020 | $5,451 | $277,700 | $131,500 | $146,200 |
| 2019 | $2,832 | $269,500 | $131,500 | $138,000 |
| 2018 | $2,776 | $263,400 | $125,300 | $138,100 |
| 2017 | $4,876 | $260,800 | $124,100 | $136,700 |
| 2016 | $2,398 | $236,000 | $124,100 | $111,900 |
| 2015 | $2,263 | $224,700 | $112,800 | $111,900 |
Source: Public Records
Map
Nearby Homes
- 38 Siasconset Dr
- 42 Siasconset Dr
- 4 Fieldwood Dr
- 4 Fieldwood Dr
- 16 Ocean Pines Dr Unit B
- 18 Ocean Pines Dr Unit A
- 18 Ocean Pines Dr Unit B
- 51 Commonwealth Ave
- 51 Commonwealth Ave
- 133 Phillips Rd
- 67 Phillips Rd
- 67 Phillips Rd
- 33 Buzzards Bay Ave
- 10 Tecumseh Rd
- 311 Phillips Rd
- 5 Oakwood Dr
- 1 Wildwood Ln Unit D
- 6 Louis Ave
- 0 State Rd
- 15 Route 6a