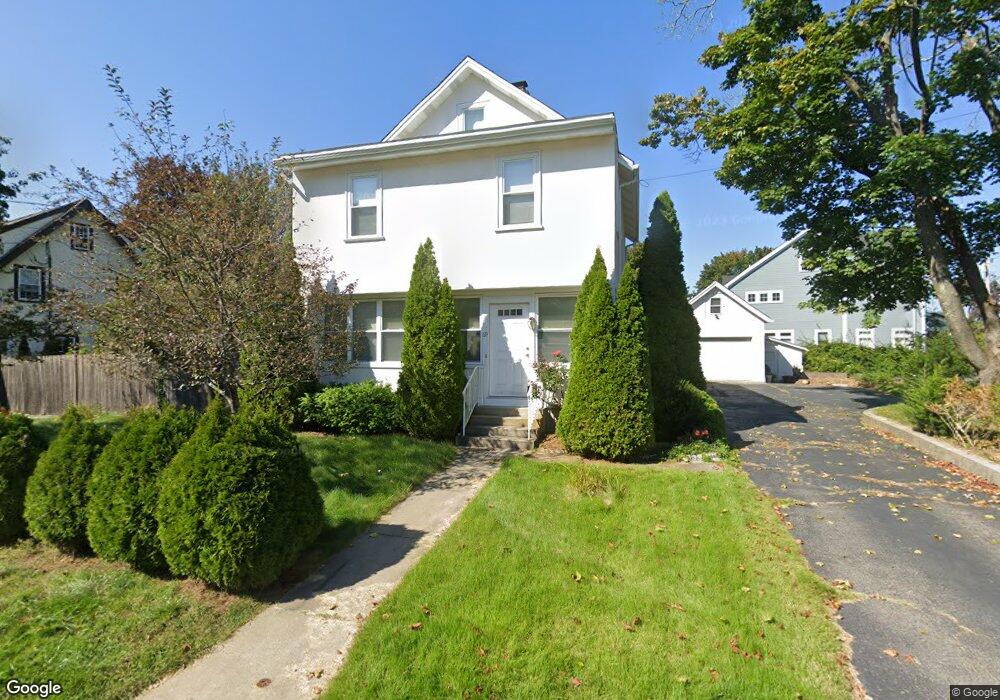
69 Sachem Rd Needham Heights, MA 02494
Estimated Value: $1,017,000 - $1,232,000
3
Beds
2
Baths
1,520
Sq Ft
$744/Sq Ft
Est. Value
About This Home
This home is located at 69 Sachem Rd, Needham Heights, MA 02494 and is currently estimated at $1,131,292, approximately $744 per square foot. 69 Sachem Rd is a home located in Norfolk County with nearby schools including Eliot Elementary School, High Rock Middle School, and Pollard Middle School.
Ownership History
Date
Name
Owned For
Owner Type
Purchase Details
Closed on
Apr 27, 2006
Sold by
Ferreri Luciano and Ferreri Deborah A
Bought by
Man Hengye and Zhang Pingping
Current Estimated Value
Purchase Details
Closed on
Dec 23, 1992
Sold by
Branstiter Carol
Bought by
Fraser Deborah A and Frasre Margaret A
Create a Home Valuation Report for This Property
The Home Valuation Report is an in-depth analysis detailing your home's value as well as a comparison with similar homes in the area
Home Values in the Area
Average Home Value in this Area
Purchase History
| Date | Buyer | Sale Price | Title Company |
|---|---|---|---|
| Man Hengye | $538,000 | -- | |
| Man Hengye | $538,000 | -- | |
| Fraser Deborah A | $170,500 | -- | |
| Fraser Deborah A | $170,500 | -- |
Source: Public Records
Mortgage History
| Date | Status | Borrower | Loan Amount |
|---|---|---|---|
| Open | Fraser Deborah A | $350,000 | |
| Closed | Fraser Deborah A | $357,000 | |
| Closed | Fraser Deborah A | $383,000 |
Source: Public Records
Tax History Compared to Growth
Tax History
| Year | Tax Paid | Tax Assessment Tax Assessment Total Assessment is a certain percentage of the fair market value that is determined by local assessors to be the total taxable value of land and additions on the property. | Land | Improvement |
|---|---|---|---|---|
| 2025 | $9,638 | $909,200 | $749,300 | $159,900 |
| 2024 | $8,630 | $689,300 | $483,700 | $205,600 |
| 2023 | $8,762 | $671,900 | $483,700 | $188,200 |
| 2022 | $8,196 | $613,000 | $432,200 | $180,800 |
| 2021 | $7,987 | $613,000 | $432,200 | $180,800 |
| 2020 | $7,674 | $614,400 | $432,200 | $182,200 |
| 2019 | $7,071 | $570,700 | $393,200 | $177,500 |
| 2018 | $6,780 | $570,700 | $393,200 | $177,500 |
| 2017 | $6,532 | $549,400 | $393,200 | $156,200 |
| 2016 | $6,340 | $549,400 | $393,200 | $156,200 |
| 2015 | $6,203 | $549,400 | $393,200 | $156,200 |
| 2014 | $5,580 | $479,400 | $328,200 | $151,200 |
Source: Public Records
Map
Nearby Homes
- 36 Davenport Rd
- 62 Evelyn Rd
- 143 Hunting Rd
- 9 Jayne Rd
- 7 Avery St
- 400 Hunnewell St Unit 103
- 379 Hunnewell St Unit 379
- 41 Lee Rd
- 3 Crescent Rd
- 35 Andrea Cir
- 23 Cheney St
- 445 Hillside Ave
- 345 Central Ave
- 556 Webster St
- 12 Hill St
- 443 Central Ave
- 130 Central Ave
- 1 Williams Ct
- 54 Indiana Terrace
- 193 Oak St Unit 403